Table of Contents
Example E20: Continuous casting of micro-alloyed Fe-Al-C-N-Nb-Ti steel, part 4: Scheil-Gulliver analysis of microsegregation
Compatibility
MatCalc version: 5.44.0021
Database: mc_fe.tdb, mc_x_FeAlCNNbTi.tdb
Author: E. Kozeschnik
Created: 2011-07-10
Revisions: G. Stechauner (2011-11-10, Updated script)
Objectives
This example describes a strategy for evaluation of primary solidification microstructures based on purely thermodynamic grounds. This analysis can be utilized for a prediction of primary precipitation and microsegregation during casting. The results can serve as a basis for defining representative compositions in subsequent precipitation kinetics simulations of enriched and depleted regions in a (micro)segregated microstructure.
The example follows the analysis presented in ref.1).
Part 4 is focussed on the prediction of microsegregation in the primary solidification microstructure using the Scheil-Gulliver simulation approach. The results are later used in the simulation of precipitation kinetics during continuous casting in example P20, where the compositions of the enriched and depleted regions are taken as the limiting cases for the chemical composition of two representative volume elements.
Related documents
Complementary files
Main document
In this part 4, the Scheil-Gulliver simulation with back-diffusion and peritectic reaction, as carried in part 3, is utilized for an analysis of microsegregation.
Setup thermodynamic system
Load the workspace file E20_3_scheil_with_bd_and_st.mcw with the simulation results of part 3 or run the corresponding script to produce the results 'on the fly'.
Analysis of microsegregation
The Scheil-Gulliver simulation scheme is capable of giving estimates of the behavior of a solidifying system in terms of
- the phase fraction evolution of the residual liquid phase
- the potential occurrence of primary precipitation
- the composition of the residual liquid phase versus temperature and/or solid/liquid phase fraction
- the composition of each solidifying crystal shell at each temperature step and/or solid/liquid phase fraction
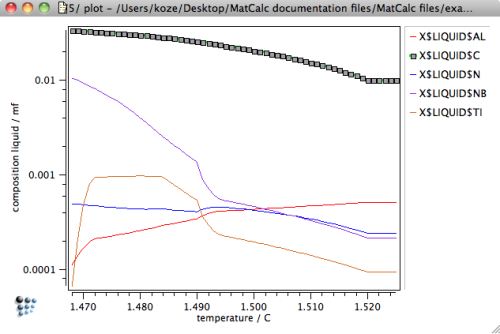
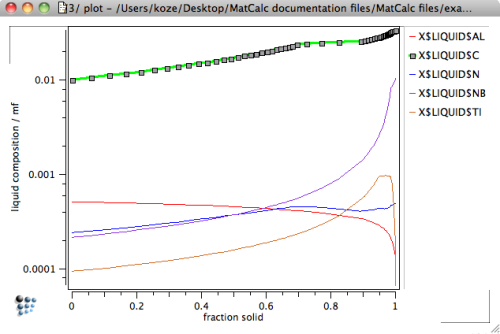
The latter two issues can be utilized in an estimate of the microsegregation behavior of the system during solidification. The following graphs show the composition of the residual liquid versus temperature and fraction solid as obtained in the previous SG-simulation back-diffusion and the peritectic reaction.
Before we assess an estimate for the amount of solute enrichment in the residual liquid phase, mind the following note:
Important …
This issue has been addressed by W. Rindler et al.2) for solidification of various low-alloy steels. In this work, the predicted solidification behavior by SG-simulation has been compared to experimentally observed solidification ranges. The authors conclude that final solidification occurs at residual liquid fractions of 1%, if solidification occurs under low cooling conditions. At fast cooling conditions, final solidification is well represented at residual liquid levels of 3%.
Composition of the enriched region
It has already been mentioned that back-diffusion of slowly diffusing substitutional species becomes more prominent if the residual liquid fraction becomes rather small. Back-diffusion is generally limiting the maximum amount of liquid enrichment. For practical simulations, this effect can be accounted for by assuming final solidification at slightly larger residual liquid fraction, i.e. at values between 3% and 5%.
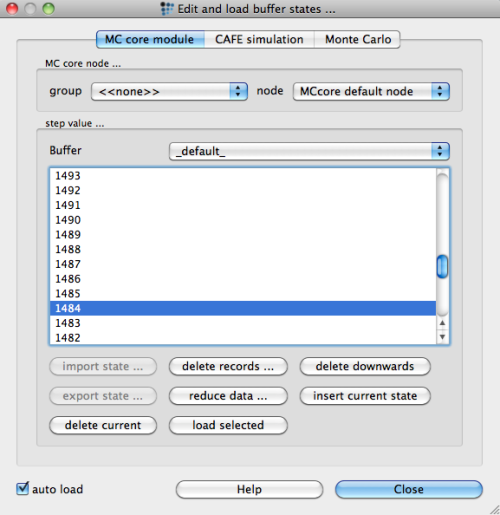
Based on these findings, we evaluate the residual liquid for continuous casting conditions at the residual liquid level of 5%. This assumption has also been made, for instance, in the work of M. Pudar et al.3) Using the 'Edit buffer states …' dialog of the 'Global' menu, browse through the calculation states
and load the state at 5% residual liquid (this is found at a temperature of 1484°C). The phase details window displays
#### /FCC_A1_TS/ moles: 0.685449, gm: -103404 (-103404), sff: 0.990638
Phasestatus: fixed
dfm: -4.29721e+00
FE +9.97545e+01   C +1.97904e-01  AL +2.70464e-02   N +5.81917e-03
NB +1.17704e-02  TI +2.96883e-03

#### /FCC_A1_S/ moles: 0.256015, gm: -103401 (-103401), sff: 0.990619
Phasestatus: fixed
dfm: -1.90052e+00
FE +9.97455e+01   C +1.98272e-01  AL +2.18335e-02   N +5.83904e-03
NB +2.18866e-02  TI +6.66063e-03

#### /LIQUID/ moles: 0.0518734, gm: -103530 (-103530), sff: 1
Phasestatus: entered - active
FE +9.88339e+01   C +6.27554e-01  NB +4.29680e-01  TI +8.33000e-02
 N +1.11991e-02  AL +1.43371e-02

#### /FCC_A1/ moles: 0.00666243, gm: -103419 (-103419), sff: 0.990577
Phasestatus: entered - active
FE +9.97145e+01   C +1.99142e-01  AL +1.80193e-02  NB +4.85131e-02
 N +5.86994e-03  TI +1.39392e-02
Note that the phase composition is shown in weight percent. You can modify this setting in the 'options' for the 'phase details' window.
The composition of the enriched regions of the primary solidification microstructure is finally found with
| C | Al | N | Nb | Ti |
|---|---|---|---|---|
| 0.63 | 0.014 | 0.011 | 0.43 | 0.083 |
Composition of the depleted region
After identifying the composition of the enriched regions of the primary solidification microstructure, we assess the composition of the depleted region. For this, we recall that the equilibrium phases that are connected to the 'solid' phases are used in the SG-algorithm to evaluated the partial equilibrium between the actual residual liquid and the newly formed solidified shell around the existing solid phases. In this sense, the solute-depleted regions of the solidified microstructure are represented by the first shell of solid material that forms from within the liquid phase. Again, we browse through the buffer and find the first solidified matrix phase at 1519°C. The phase details window shows
#### /LIQUID/ moles: 0.941634, gm: -106716 (-106716), sff: 1
Phasestatus: entered - active
FE +9.96914e+01   C +2.31203e-01  AL +2.47826e-02   N +6.36468e-03
NB +3.77430e-02  TI +8.47155e-03

#### /BCC_A2/ moles: 0.0583657, gm: -106653 (-106653), sff: 0.998046
Phasestatus: entered - active
FE +9.99189e+01   C +4.05070e-02  AL +2.84828e-02   N +1.85929e-03
NB +8.07260e-03  TI +2.14686e-03
The composition of the solute-depleted region is identified as the composition of the BCC_A2 phase at the beginning of solidification. The following table summarizes the observed values and compares them to the nominal composition.
| condition | C | Al | N | Nb | Ti |
|---|---|---|---|---|---|
| nominal | 0.22 | 0.025 | 0.0061 | 0.036 | 0.0081 |
| enriched | 0.63 | 0.014 | 0.011 | 0.43 | 0.083 |
| depleted | 0.04 | 0.028 | 0.0019 | 0.0081 | 0.0021 |
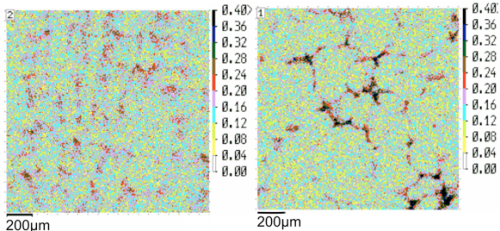
The Scheil-Gulliver analysis predicts strong composition differences in the enriched and depleted regions. The predictions are, at least qualitatively, confirmed by experimental investigation. The following graph shows the amount of V segregation detected by micro probe analysis,4) thus confirming the observed tendencies for segregation.
Note that Al shows inverse segregation, since this element is enriched in the solid phase and depleted in the liquid. All other elements show positive segregation, typically in the order of a factor 5 to 50.
Final back-diffusion step
In systems with fast diffusing elements, such as the interstitial/substitutional alloy considered in the present example, a final consideration must be made for a realistic estimate of the composition of the enriched and depleted regions. In our Scheil-Gulliver simulation with back-diffusion, partial equilibrium is evaluated after each Scheil step in order to account for back-diffusion. In the present case, the last partial equilibrium has been calculated between the already solidified phases and the residual liquid. On transformation of the residual liquid into solid, the solubilities for the fast diffusers change drastically, however, since the solid phases can usually dissolve much less solute atoms than the liquid. As soon as final solidification has completed, the fast diffusers rapidely establish partial equilibrum again, which practically means that the fast elements diffuse away from the previous residual liquid regions because their solubility is now comparable to the surrounding regions.
In a first and rough approximation, this effect can be accounted for by assuming that the fast diffusers distribute homogeneously in the segregated microstructure. In the chemical composition table, the original values for C and N have thus been replaced by the nominal content. The values for the substitutional elements are left identical. The following table thus represents the best-practice estimates of the chemical composition of the enriched and depleted regions.
| condition | C | Al | N | Nb | Ti |
|---|---|---|---|---|---|
| nominal | 0.22 | 0.025 | 0.0061 | 0.036 | 0.0081 |
| enriched | 0.22 | 0.014 | 0.0061 | 0.43 | 0.083 |
| depleted | 0.22 | 0.028 | 0.0061 | 0.0081 | 0.0021 |
Save the final results in workspace E20_4_scheil_microsegregation.mcw.
Consecutive articles
This analysis is continued in article Precipitation simulation during continuous casting.


