Table of Contents
Example E20: Continuous casting of micro-alloyed Fe-Al-C-N-Nb-Ti steel, part 2: Scheil-Gulliver analysis of primary precipitation
Compatibility
MatCalc version: 5.44.0021
Database: mc_fe.tdb, mc_x_FeAlCNNbTi.tdb
Author: E. Kozeschnik
Created: 2011-07-06
Revisions: 2011-11-03 (G. Stechauner, Update for new Database)
Objectives
This example describes a strategy for evaluation of primary solidification microstructures based on purely thermodynamic grounds. This analysis can be utilized for a prediction of primary precipitation and microsegregation during casting. The results can serve as a basis for defining representative compositions in subsequent precipitation kinetics simulations of enriched and depleted regions in a (micro)segregated microstructure.
The example follows the analysis presented in ref.1).
Part 2 makes use of the Scheil-Gulliver simulation method to estimate the possible existence of primary carbonitride precipitates. The analysis is performed based on the results of the previous equilibrium analysis of example E20, part 1. The primary precipitates are assumed to form in the residual liquid pockets of the solidifying microstructure. The example makes use of the back-diffusion and solid-solid transformation features of MatCalc.
Related documents
Complementary files
Main document
In part 1 of this example, an equilibrium analysis of the expected precipitate phases has been performed, with the result that AlN, TiN and NbC carbonitrides can become stable during cooling after solidification. In this part 2, the Scheil-Gulliver simulation scheme is utilized to investigate the question, whether one can expect the precipitates already to form as primary precipitates within the liquid state.
Setup thermodynamic system
Load the workspace file E20_1_equilibrium.mcw with the simulation results of part 1 or run the corresponding script to produce the results 'on the fly'.
Standard Scheil-Gulliver simulation
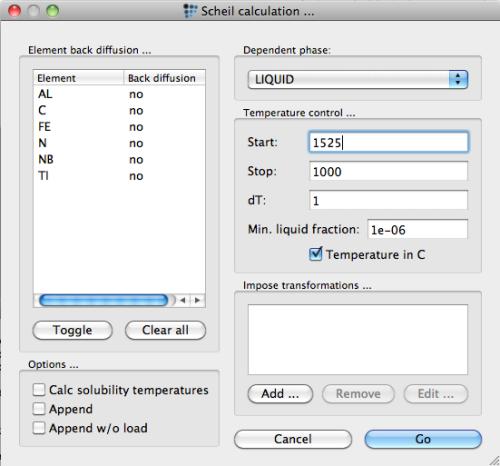
For the Scheil-Gulliver simulation of primary precipitation, open the 'Scheil simulation…' dialog from the 'Calc' menu. Select 'liquid' as the dependent phase and 1525°C as the starting temperature.2) Press the 'Go' button to start the simulation.
After starting the simulation, MatCalc prompts with a message that it needs to create 6 new phases:
These phases are the so-called 'solid phases' with a phase name suffix '_S'. These phase objects store the accumulated element amounts that the Scheil algorithm attributes to the solidified material. Since these new phases are required for the Scheil-Gulliver simulation, confirm with 'Yes'. The calculation then starts.
In the output window, you can follow and check the simulation progress. Always check for possible error messages or warnings. For an interpretation of the new phase objects, load the calculation state at 1450°C from the buffer (CTRL+L, then select record at 1450°C). The 'phase summary' window should display the following information
LIQUID       *	act	1.10269e-01  dfm: +0.00000e+00
FCC_A1       	act	2.01245e-03  dfm: +0.00000e+00
FCC_A1#02    	act	1.94705e-06  dfm: +0.00000e+00

### inactive ###
BCC_A2_S     	dorm.	6.34302e-01  dfm: -1.68430e+02
FCC_A1_S     	dorm.	2.53400e-01  dfm: -2.67197e+01
FCC_A1#02_S  	dorm.	1.51624e-05  dfm: -7.79116e-01
BCC_A2       	- OK -	0.00000e+00  dfm: -1.16963e+02
FCC_A1#01    	- OK -	0.00000e+00  dfm: -7.41719e+03
CEMENTITE    	- OK -	0.00000e+00  dfm: -8.57631e+03
CEMENTITE_S  	dorm.	0.00000e+00  dfm: -8.71983e+03
FCC_A1#01_S  	dorm.	0.00000e+00  dfm: -1.14733e+04
ALN          	- OK -	0.00000e+00  dfm: -1.57929e+04
ALN_S        	dorm.	0.00000e+00  dfm: -1.57929e+04
The list of phases in this window shows that each equilibrium phase, except the dependent LIQUID phase, are connected to a phase with suffix '_S'. The phase status of these phases is 'dormant', because they shall not be affected by any equilibrium calculation. Instead, their constitution is controlled by the Scheil algorithm: After each temperature step, which involves an equilibrium simulation between liquid and 'non-solid' phases, the phase amounts and compositions of the 'non-solid' phases are accumulated in the corresponding 'solid' phases. In this sense, the constitution of the 'solid' phases represents the accumulated, mean properties of the solidified material, whereas the 'non-solid' equilibrium phase represents the amount and composition of the newly solidified 'shell' around the material which has solidified in previous steps.
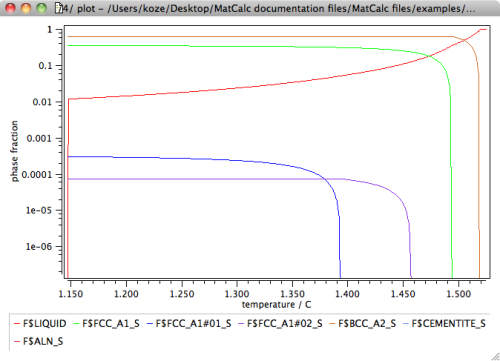
For further analysis, let us display the results in terms of the phase fractions of liquid and of solid phases versus the fraction residual liquid. Create a new X-Y-data plot window from the 'Create new window …' dialog of the 'View' menu. Drag and drop the phae fraction variable F$liquid and all phase fractions of the 'solid' phases with suffix '_S' into the plot. Display the y-axis in log scale.
A most disturbing observation in the above diagram is that the residual liquid phase is stable down to a temperature of about 1150°C. This is in clear contradiction to experience, which suggests a solidification range for this type of steel of clearly less than 100K. The reason for this unexpected behavior can be attributed to the massive segregation of interstitial elements, in particular C, into the residual liquid.
Back-diffusion of fast diffusers
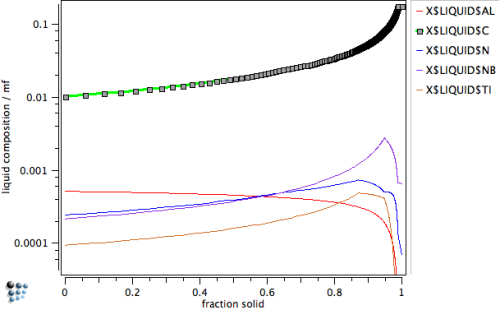
Create a new diagram, where the composition of the liquid is plotted versus the solid phase fraction3), to investigate this unexpected behavior.
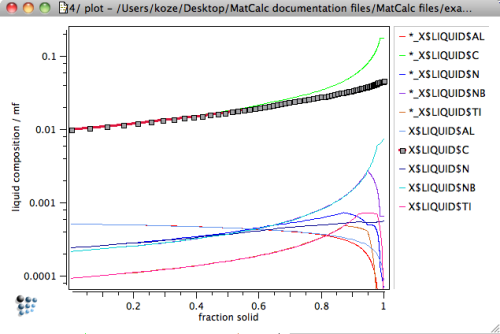
The diagram clearly shows that the standard Scheil-Gulliver simulation predicts heavy solute enrichment of the liquid phase. In particular, we observe segregation of C, which enriches in the liquid by a factor of almost 20 compared to the nominal composition.
In the classical Scheil-Gulliver approach, the assumption is made that diffusion of elements in the liquid is infinitely fast, while diffusion in the solid is assumed to be negligibly slow. This assumption is a good approximation of the conditions during solidification, if only substitutional elements are considered. For interstitial elements, however, the second assumption is hardly valid since interstitial elements are fast diffusers. After being rejected into the liquid phase within each solidification step of the Scheil-Gulliver procedure, elements, such as C and N, are capable of diffusing rapidly also in the solid phase and establish partial equilibrium between the liquid and solid phases. This process is known as back-diffusion.
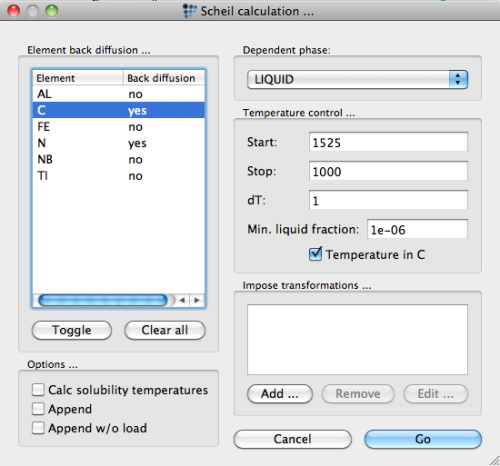
In order to account for this process in the simulation, check the corresponding option in the 'Scheil calculation…' dialog of the 'Calc' menu. Make sure you select back-diffusion 'yes' for C and N.
Perform the Scheil-Gulliver calculation again. The following plot displays the composition of the liquid phase now for both cases, with and without back-diffusion.4)
If back-diffusion is taken into account, the enrichment of interstitial elements, as well as all other components, is significantly reduced in the late stages of the solidification process. The enrichment in C becomes less than a factor of 5, compared to 20 in the classical calculation.
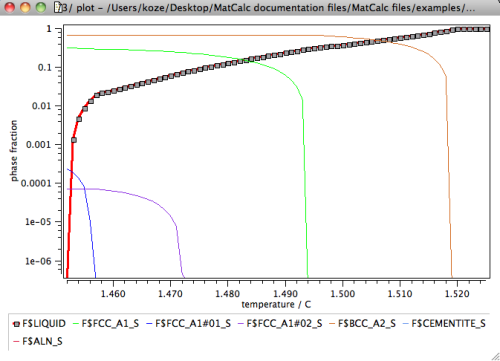
The major consequence of taking back-diffusion of C and N into account is shown in the following phase fraction versus temperature plot.
The phase fraction of the residual liquid now decreases sharply below a temperature of 1457°C, and goes down to zero at 1453°C, which is a result that is much closer to experimental evidence. By taking into account back-diffusion, the solidification temperature changed by more than 300K.
Analysis of primary precipitation
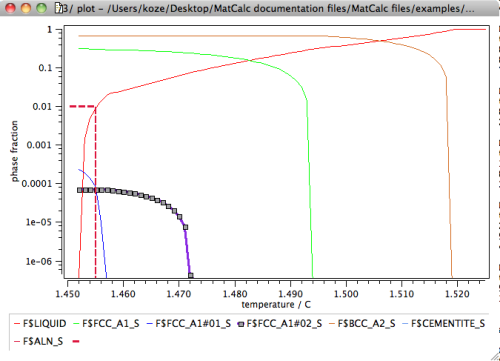
With these results, it is straightforward, now, to evaluate the potential for primary precipitation. Preliminary analysis has indicated5) that final solidification of alloys treated within the Scheil-Gulliver algorithm occurs at residual liquid fractions between 3% and 1%. The higher value applies to situations where faster cooling rates are utilized, whereas the lower limit is representative for slow cooling conditions present, for instance, during casting of heavy components. The following figure shows the phase fraction diagram obtained in the previous simulation together with a line drawn at 1% residual liquid.
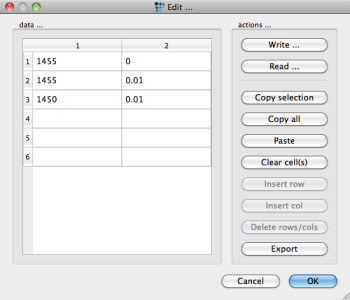
Tips & tricks: The dashed solid line in the plot was created from a global table with coordinates
and a 'table/experimental data' series with reference to this table. The settings for the line appearance must be made manually.
The phase fraction plot at 1% residual liquid and the highlighted line for the FCC_A1#02 phase clearly indicate that a primary precipitate should be present in the solidified microstructure. The phase fraction line starts 18K above the 1% residual fraction limit and reaches 0.01% phase fraction at 1455°C.
Load the calculation state at 1455°C from the buffer to identify the type of primary precipitate from the phase details window:
#### /BCC_A2_S/ moles: 0.68166, gm: -100755 (-100755), sff: 0.992364
Phasestatus: fixed
dfm: -9.26490e+01
FE +9.91710e-01   C +7.47176e-03  AL +5.57307e-04   N +1.63756e-04
NB +6.46725e-05  TI +3.22608e-05

#### /FCC_A1_S/ moles: 0.30433, gm: -100692 (-100692), sff: 0.9849
Phasestatus: fixed
dfm: -4.62754e+00
FE +9.84239e-01   C +1.48040e-02  AL +4.29762e-04   N +2.96053e-04
NB +1.59508e-04  TI +7.14587e-05

#### /LIQUID/ moles: 0.008906, gm: -100721 (-100721), sff: 1
Phasestatus: entered - active
FE +9.47243e-01   C +4.50541e-02  NB +6.59235e-03   N +5.55024e-04
TI +3.98685e-04  AL +1.57129e-04

#### /FCC_A1/ moles: 0.00489273, gm: -100702 (-100702), sff: 0.98478
Phasestatus: entered - active
FE +9.83866e-01   C +1.49204e-02  NB +6.36619e-04   N +2.99274e-04
AL +2.22510e-04  TI +5.56083e-05

#### /FCC_A1#01_S/ moles: 7.99976e-05, gm: -147078 (-147078), sff: 0.505371
Phasestatus: fixed
dfm: -5.04949e+01
 C +4.88369e-01  NB +4.22221e-01  TI +8.22984e-02   N +6.26006e-03
FE +8.51803e-04  AL +2.22771e-10

#### /FCC_A1#02_S/ moles: 7.23917e-05, gm: -226252 (-226252), sff: 0.500284
Phasestatus: fixed
dfm: -3.84475e+03
TI +4.93216e-01   N +4.44627e-01   C +5.50894e-02  NB +7.01288e-03
FE +5.48442e-05  AL +7.57734e-15

#### /FCC_A1#01/ moles: 5.88769e-05, gm: -145993 (-145993), sff: 0.505629
Phasestatus: entered - active
 C +4.87936e-01  NB +4.39390e-01  TI +6.53351e-02   N +6.43467e-03
FE +9.03661e-04  AL +2.12375e-10
This printout of the phase details window shows that the primary precipitate FCC_A1#02_S is composed of mainly Ti and N. This is surprising, at first sight, because there are only trace amounts of Ti present in the nominal composition. However, this element has extremely high tendency for segregation and, thus, is strongly enriched in the residual liquid. This feature of Ti provides the driving force for primary precipitation of the TiN phase from the residual liquid.
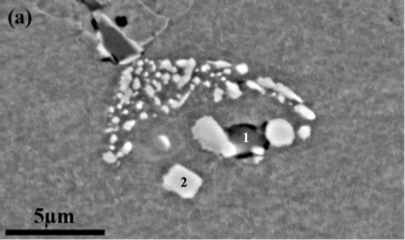
The simulation also suggests that primary NbC precipitates should be present, since this phase, FCC_A1#01_S, has approximately the same phase fraction at the limit of 1% residual liquid compared to the TiN phase. This is confirmed by experimental observation.
The following micrograph reproduces experimental results from the above mentioned publication, confirming the existence of primary precipitates. In the figure, EDX analysis has shown that the precipitate on spot 1 is a MnS particle, whereas the precipitate at spot 2 is NbC. Note that sulphides have not been included in the simulations for the merit of simplicity.
Save the final results in workspace E20_2_scheil_with_bd.mcw.
Consecutive articles
This analysis is continued in article Accounting for the peritectic reaction.
1-f$liquid for the default-x-data expression in the options window