Table of Contents
Example E2: Stable and meta-stable phases in Al-Cu
Compatibility
MatCalc version: 5.44.1002
Database: mc_sample_al2.tdb (Version 1.007)
Author: Georg Stechauner
Created: 2012-01-09
Revisions: Updated to new Database
Note: Make sure that you use version 1.007 of the sample database!
Objectives
This example demonstrates how to create a phase diagram for Al-Cu containing both stable and meta-stable phases. The technically relevant composition range up to 10% Cu is covered in the simulations. Using this phase diagram, information on the nucleation characteristics and precipitation sequences of meta-stable phases can be gained.
The simulations are compared to experimental kinetics data on solution temperatures.
Consult Tutorial T8 or Example E1 to refresh your knowledge on phase diagram calculations.
Related documents
- Chao Jian, PhD thesis, 'Theoretical studies of aluminum and aluminide alloys using CALPHAD and first-principles approach', August 2004, Pennsylvania State University.
Complementary files
Click here to view the script for this tutorial.
Main document
Setup thermodynamics
Start by opening the aluminium database. Select the elements Al and Cu and the phases FCC_A1 (Aluminium matrix phase), Liquid, THETA_AL2CU (Stable Al-Cu Theta phase), THETA_PRIME (Meta-stable Theta prime phase) and TH_DP (Meta-stable Theta double-prime). Read the database.
Define the composition of the system as shown below, set automatic start values and calculate an equilibrium at 500C (values in wt-%):
| Al | Cu |
|---|---|
| * | 1.0 |
Stable vs Meta-stable
After setting up the system and calculating equilibria at different temperatures and different Cu-contents, only FCC_A1, Liquid and Theta_Al2Cu are found to be stable phases. Even after changing the chemical composition to higher Cu values and calculating more equilibria, Theta_Prime and Theta_Double-prime will never be observed in the set of stable phases.
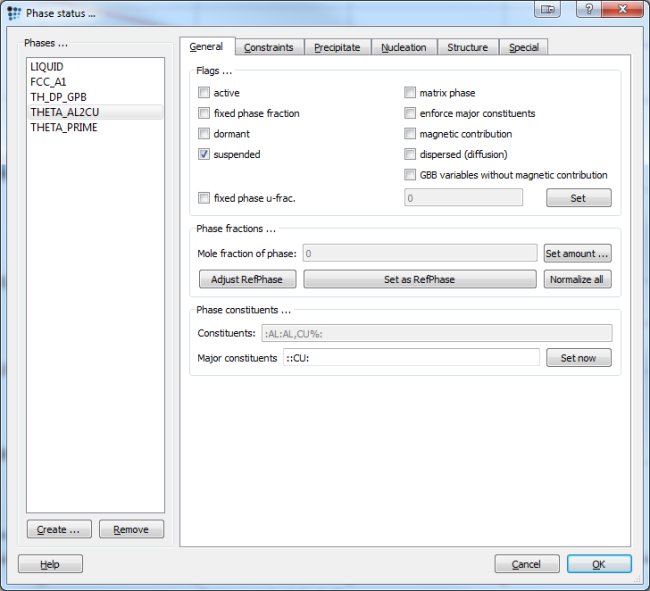
The reason for this behaviour is that Theta_Al2Cu is the stable, Cu-rich phase, which will form under equilibrium conditions. In order to evaluate a phase diagram with meta-stable Theta_Prime and Theta-Double-prime, respectively, we need to suspend in each case the stable phase.
Important note…
The second approach will be used hereafter.
Calculation of phase fraction diagrams
Since we are only interested in the technically relevant pre-eutectic area, the calculation range will be set from 0 to 10% Cu. The temperature range is relatively small due to the low melting temperatures and can be set from 0 to 700C.
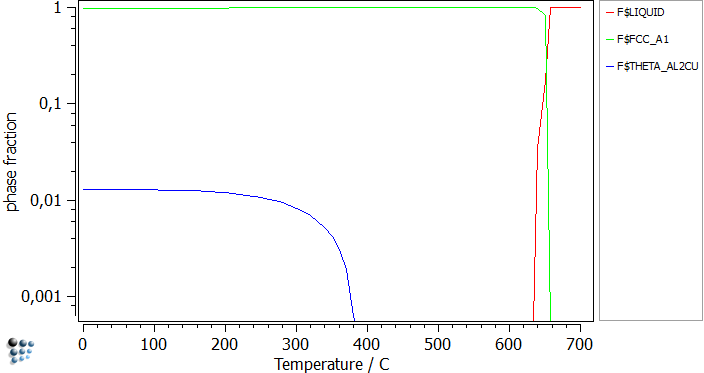
Assuming that this alloy is unknown to us, and we have no literature about it whatsoever, a good way to begin the equilibrium analysis is to plot the phase fraction diagram in a stepped calculation.
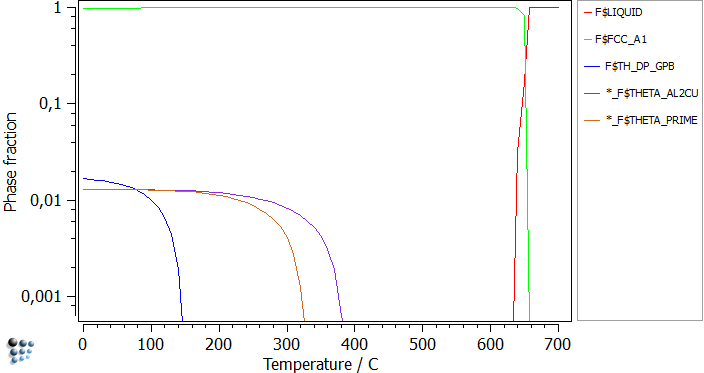
This diagram confirms that only the well-known stable phases appear in the simulations. Furthermore it gives an idea of the temperatures to start the calculations from. By repeating this step, but suspending THETA_AL2CU phase, first THETA_PRIME and after that TH_DP will become the stable phases. The only difference is the phase fraction and the nucleation temperature.
After suspending the phases, plotting the phase fractions, and locking them, the figure below can be obtained:
Calculation of phase diagram
To continue with the creation of the phase diagram, which shows stable and meta-stable phases, first un-suspend all phases once again.
As the temperature differences are not as big as in the Fe-C system, the same temperature can be used for all phases to find them.
- Calculate an equilibrium at 600C
- Search the phase boundary of the liquid phase
- Perform a stepped calculation in the range defined above
- Plot
T$C, lock and rename it.
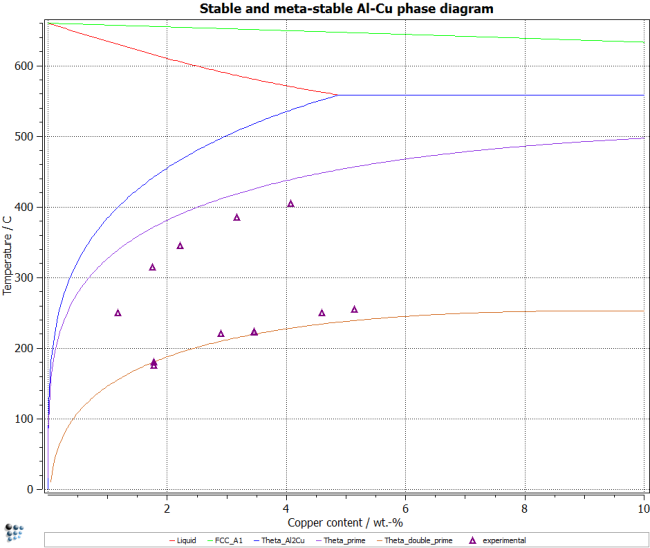
Repeat this step for all three stable phases. To plot the meta-stable phase boundaries, suspend the stable AL2CU phase. Then repeat the steps above. Suspend the Theta-Prime phase, in order to stabilize the Theta-double-Prime phase. The resulting diagram should look like the figure below.
The experimental data shown in the figure is taken from the PhD thesis of Chao Jian (see related documents section). Add these data points by entering them into a table and then adding an experimental seris to the plot. See tutorial T10 for details on this procedure or the accompanying script to see how these things are done from within a MatCalc script.
Note: The experimental data measured for nucleation of Theta-Prime phase is lower than the calculated equilibrium data. The reason is that nucleation of these phases always involves coherency stresses, since they are found to be coherent with the matrix. This energy contribution destabilizes the precipitates, which is why experiments show a lower solution temperature compared to the equilibrium calculation, which considers the ideal case of very large precipitates (no interfacial curvature) and no coherency stresses.
Important note…
For some phases in the Al-Al2Cu phase diagram, you might have problems finding phase boundaries and following them automatically. Circumvent this by manually finding points on this line with the 'Search phase boundary' tool (vary chemical composition) and then plot those points as a table (not very elegant solution, but at least a workaround).
Consecutive articles
none


