Table of Contents
Example E1: Stable and meta-stable phase diagram of Fe-C-Mn
Compatibility
MatCalc version: 5.44.0013
Database: mc_sample_fe.tdb
Author: Georg Stechauner
Created: 2011-09-29
Revisions:
Objectives
In this example, the basic features of ortho- and para-equilibrium are explored. This will be done by investigating the influence of Mn on the Fe-C-Mn phase diagram. Moreover the procedure of calculating phase diagrams will be repeated.
Instructions for how to perform simple equilibrium calculations are shown in the corresponding tutorials.
Related documents
- E. Kozeschnik, J. M. Vitek, “Ortho-equilibrium and para-equilibrium phase diagrams for interstitial / substitutional iron alloys”, Calphad, Volume 24, Issue 4, December 2000, Pages 495-502
Complementary files
Click here to view the script for this tutorial.
Main document
Setup thermodynamics
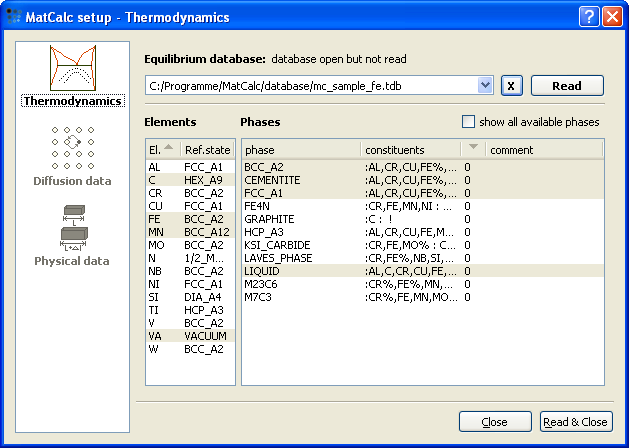
As usual, start with setting up the thermodynamics. We use the thermodynamic database mc_sample_fe.tdb and select the elements and phases according to the figure below.
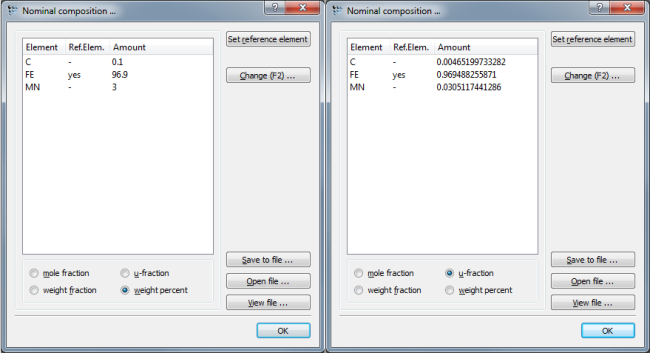
Open the composition window and define the C and Mn contents (in wt%):
| C | Mn |
|---|---|
| 0.1 | 3.0 |
Calculate equilibrium at 1500C.
Ortho-equilibrium vs Para-equilibrium
As mentioned before, there are two different equilibria that can easily be evaluated with MatCalc:
Important note…
- Ortho-quilibrium: Ortho-equilibrium is the particular type of equilibrium that is characterized by the absolute minimum of the Gibbs energy. In ortho-equilibrium, all elements and phases have reached their equilibrium state. Typically, the chemical composition of individual phases is different from each other due to partitioning of elements. Partitioning occurs for fast and slow diffusers equally.
- Para-equilibrium: Para-equilibrium is a (compositionally) constrained equilibrium, where only fast (interstitial) elements like C, N, etc., are sufficiently mobile to reach equilibrium by partitioning between the phases. Para-equilibrium is a typical condition that is observed, e.g., during low-temperature phase transformations in steel. Substitutional elements, such as Mn, Si, Cr, Mo, etc., are too sluggish at temperatures below approx. 500 to 600C to partition between phases. They are 'frozen in' during transformations and the product phase typically inherits the substitutional element content of the parent phase.
Calculation of phase diagram: Ortho-equilibrium
Even though we are only interested in the eutectoid area of the phase diagram, we will still calculate the whole diagram to repeat the lesson learned in the tutorial. The experienced user can choose to only calculate the eutectoid area, ranging from 0 to 1% C and from 450 to 900C.
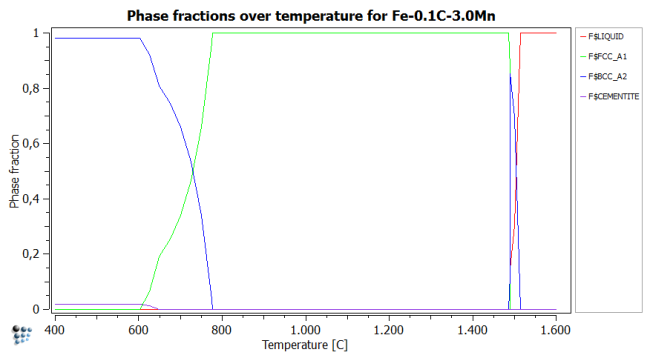
Start off by plotting the phase fractions over temperature for the given chemical composition. This figure shows where new phases form, hence where searching for a phase boundary will be smart.
Important note …
If you start the search procedure too far away from the phase boundary, MatCalc might fail to identify the boundary. Start your search by performing an equilibrium simulation somewhere in phase space, which is supposedly close to the phase boundary that you are seeking.
With the help of this figure, the following temperatures to search phase boundaries are chosen:
- bcc_high_1 (upper boundary of delta-ferrite): 1530°C
- liquid (lower boundary of liquid): 1500°C
- bcc_high_2 (lower boundary of delta ferrite): 1400°C
- fcc_1 (upper boundary of austenite): 1500°C
- bcc_low (upper boundary of alpha-ferrite): 900°C
- fcc_2 (lower boundary of austenite): 600°C
- cementite (cementite upper phase boundary): 600°C
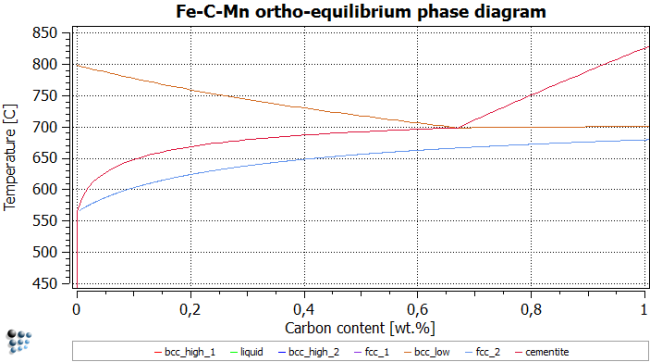
Perform a 'stepped equilibrium' calculation of the 'phase boundary' type for each phase boundary listed above and plot T$C in a xy-plot window. 'Duplicate and lock' the results and rename them accordingly. Consult T8 if you need help. Start with a step width of 0.02 to ensure both accuracy of calculated curves and fast calculation times.
Important note …
There are two approaches to circumvent this error:
- Increase the allowed maximum temperature step to a higher value (e.g.: 200). This will not slow down the calculation and should be the preferred approach.
- Decrease the step width from the initial 0.02 to 0.001. This however WILL increase the calculation time greatly (dependent on your CPU!).
Calculation of phase diagram: Para-equilibrium
Create a new plot for 'Para-equilibrium Fe-C-Mn'.
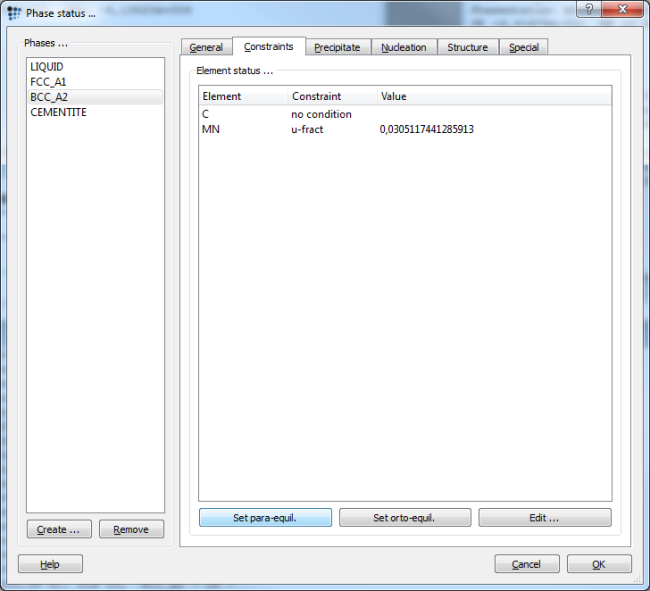
To calculate para-equilibrium instead of full-partitioning ortho-equilibrium, we have to change the compositional constraints in the 'Constraints' tab of the 'Phase status…' dialog. Press 'Set para-equil.' and repeat this for all phases, except for liquid.1) The figure below shows the correct settings for a para-equilibrium calculation. Note: There is no need to set the para-equilibrium constraint to the high temperature region, as the mobility is high enough for all elements to establish equilibrium partitioning. Therefore, calculate the high temperature part of the phase diagram down to about 800C without compositional constraints. Use the para-equilibrium constraint for the phases below 800C, only.
An alternative route to setting the para-equilibrium constraints can be taken by opening the 'Nominal composition…' (F7) dialog. Change the composition to 'u-fraction', and read the Mn u-fraction for later use in the dialog box or a script.
Use the following commands to set the constraint for temperature region below 800C:
change-phase-status fcc_a1 c mn u 0.0305117     $ Set constraint for Mn in fcc_a1 phase
change-phase-status bcc_a2 c mn u 0.0305117     $ Set constraint for Mn in bcc_a2 phase
change-phase-status cementite c mn u 0.0305117  $ Set constraint for Mn in cementite phase
Important note …
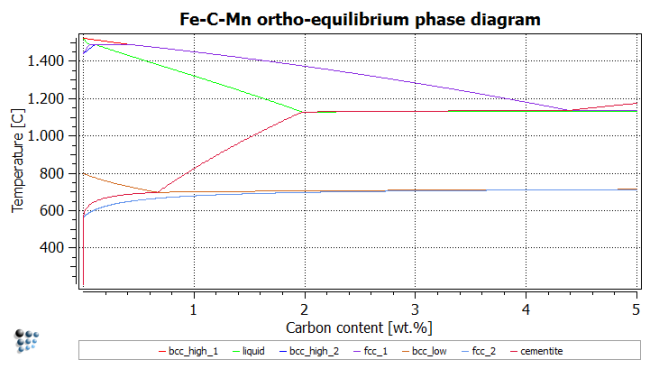
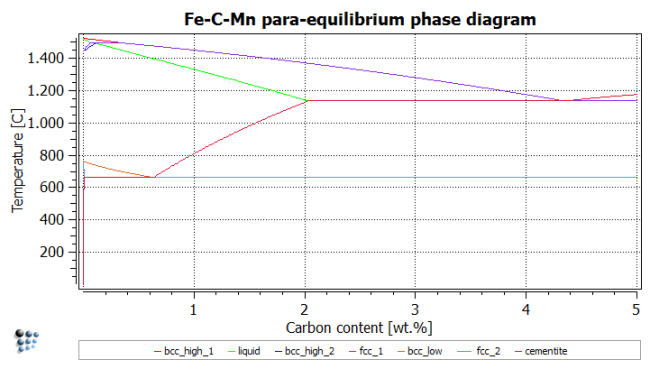
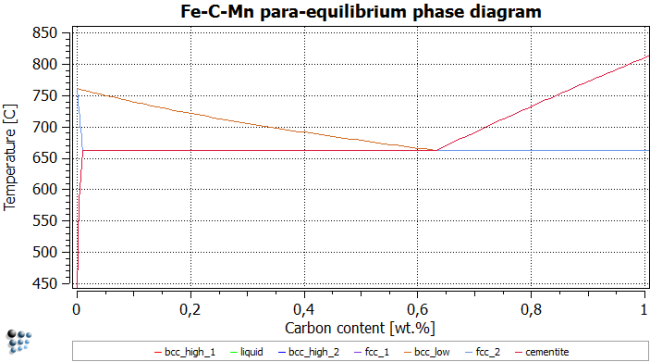
Use the same temperatures as above to find the phase boundaries, and repeat post-processing. After renaming title, axes, series etc., the figure should look like this:
Comparison
It is interesting to analyze the impact of Mn on the stable and metastable equilibrium phase diagrams. From the following figures, it is observed that para-equilibrium constraints for Mn lower the ferrite transformation start temperature (bcc_low line) by approximately 35 °C. On the other hand, at very low carbon contents, the para-equilibrium eutectoid temperature can be significantly higher than the corresponding temperature under full equilibrium conditions.
One can now conclude that, on quenching, this fact allows for the formation of metastable para-equilibrium cementite that is not stable under full equilibrium conditions. Experimental evidence for the existence of para-equilibrium cementite is described for the tempering of martensite. Another observation from these calculations is that, at very low C content, austenite could transform into 100 percent ferrite, according to the para-equilibrium phase diagram, whereas under ortho-equilibrium conditions the system would still be in the austenite / ferrite two-phase field. Consequently, austenite could completely dissolve by a rapid reaction and subsequently re-precipitate when approaching the full equilibrium state.
Consecutive articles
none.
