Table of Contents
T6: Introduction to user-defined functions and variables
This tutorial was tested on
MatCalc version 6.04 rel 1.001
license: free
database: mc_fe.tdb
Complimentary files
Click here to view the script for this tutorial.
Contents
- Expressions using built-in variables
- Creating a new function
- Using functions
- Defining and using variables
Setting up the system
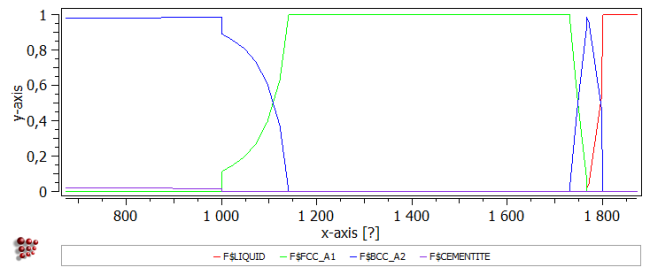
Define a system containing the elements Fe and C and and phases LIQUID, FCC_A1, BCC_A2 and CEMENTITE. Enter the composition 0.1 wt.% C. Make a stepped equilibrium calculation, varying the temperature from 400 to 1600°C in 25-degree intervals.
Create a new plot window and drag and drop 'F$*' from the 'Variables' window into the plot.
Create a second plot in the same window. Set the 'default x-data' in the Options window to 'T$C', and define a default x-axis for all plots labelled 'Temperature [°C]'.
Combining built-in variables in new expressions
In systems consisting of a matrix and carbides, it may be interesting to determine how much of the carbon in the system is present in the form of carbides, and how much remains in the matrix phase(s), at any given temperature.
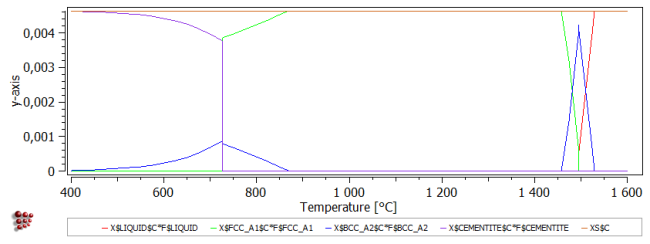
The phase fraction 'F$*' represents the number of moles of phase per mole of system, and the carbon content of a phase 'X$*$C' represents the number of moles of carbon per mole of phase. The product of these quantities for a given phase gives the number of moles of carbon in the phase.
To plot this, first drag 'X$*$C' to the new plot to give the carbon content of each phase. Then go to the 'variables' window, select 'F$LIQUID' and copy it using the right-click menu.
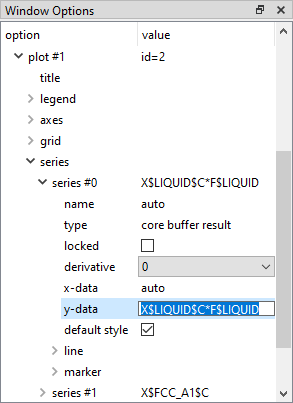
Click on the lower plot, and in the 'Options' window, edit the 'y-data' line for the first series ('series #0') of this plot. This should currently read 'X$LIQUID$C'. Append '*F$LIQUID' to this - this can be done by pasting the previously copied 'F$LIQUID' text.
Repeat this process for the other series to give 'X$BCC_A2$C*F$BCC_A2', 'X$FCC_A1$C*F$FCC_A1' and 'X$CEMENTITE$C*F$CEMENTITE'. Add another variable to the plot: 'XS$C' (can be found in the 'composition' section), the mole fraction of carbon in the system. This should be equal to the sum of the other four variables on the plot.
The final plot is shown below:
Defining functions
Creating a new function
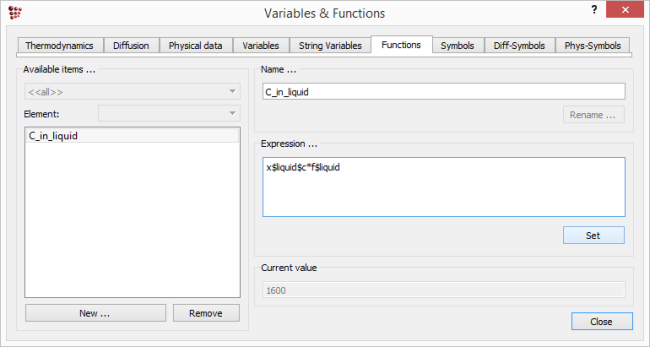
If the expressions such as 'X$BCC_A2$C*F$BCC_A2' are likely to be used more than once, they can be defined as functions. Select 'Global > Variables & Functions'. This brings up a box containing several tabs; click on 'Functions'.
Click on 'New' and type in a name for the function in the box which appears, for example, 'C_in_liquid'. In the 'Expression' box, type in 'X$LIQUID$C*F$LIQUID'. For convenience, this can be copied from the 'y-data' line in the 'Options' window of the plot just finished. (N.B. There is no need to put an '=' sign at the beginning of the expression.) Click on 'Set' to register the expression. Repeat for the three other expressions plotted above.
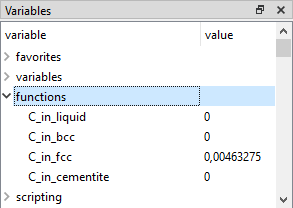
Close the 'Functions & Variables' box to return to the main screen. Expand 'functions' in the 'Variables' window by clicking on the small plus-sign to the left of the word. This should give a list of the new functions:
Make a new plot and drag and drop the functions just defined into it (To select multiple entries, hold 'Ctrl'-key while clicking on them), together with the 'XS$C' variable, to check that this gives the same appearance as the plot above.
New expressions using existing functions
The fraction of the total carbon content in the system which is in the liquid phase can be calculated by dividing the function 'C_in_liquid' by the total carbon content XS$C.
Re-open the 'Functions' tab in 'Variables & Functions' window and create a new function named 'Fraction_C_in_liquid'. Enter 'C_in_liquid/XS$C' in the 'Expression' box and click on 'Set'. Repeat for the other three phases.
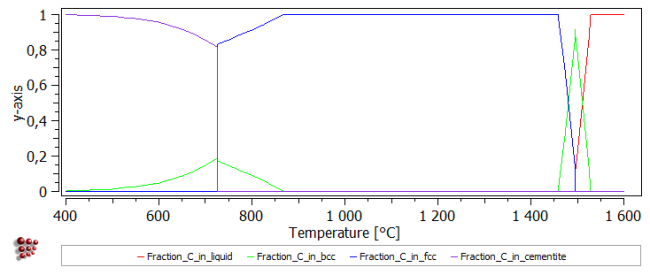
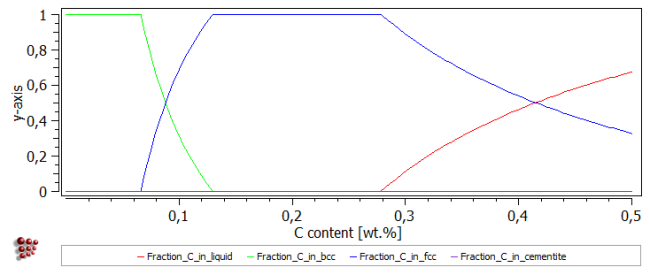
On returning to the main screen, create a new plot and drag and drop the new 'Fraction_C_in…' functions into it. (This may necessitate clicking on the triangle sign by the side of 'Functions' to close and re-open it with the new functions displayed.) The resulting plot should have the same appearance as the two plots above, but a different y-scale, this time going from 0 to 1.
The user-defined functions are saved in the workspace and can be used for all subsequent calculations in that workspace.
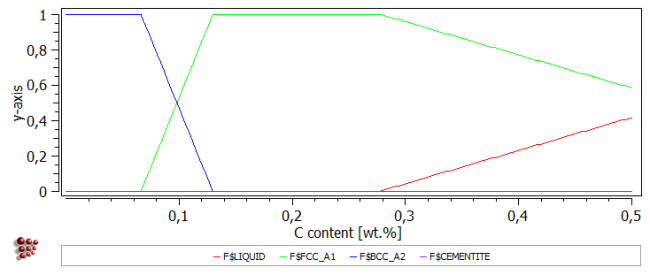
Change the 'default x-data' in the Options window to 'StepValue', and the name of the default x-axis to 'C content [wt.%]'. Make a new stepped calculation in the '_default_' buffer, varying the carbon content from 0 to 0.5 wt.% (with 0.005 step) at 1475°C .
The phase fraction curve below shows that the carbon content has a strong influence on phase stability at this temperature. Increasing the carbon content stabilises FCC_A1 at the expense of BCC_A2, and then at higher carbon contents the liquid phase also becomes stable.
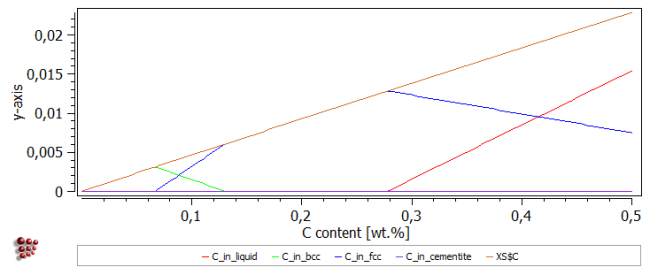
The two sets of user-defined functions appear as shown below, and in this case they provide different ways to illustrate the results.
User-defined variables
The final part of this tutorial demonstrates the use of the 'Variables' tab under 'Global > Variables & Functions'.
In the plot of C_in_liquid, C_in_bcc, etc., the curves are made up of almost straight-line sections, so it should be possible to find analytical expressions of the form y = ax +b for these, where 'a' is the gradient and 'b' the intercept on the y-axis.
The C_in_liquid line starting from around 0.28 wt.% C will be used as an example. To find an equation for this line, two (x, y) values on the line are needed. For the first of these, y=0 can be used. To find the exact x-value at which the liquid phase fraction is zero, look at the 'console' window which contains now the equilibrium phases present in the system for various carbon contents. The line starting with 'Xsol 'LIQUID' shows the LIQUID zero-phase boundary at 1475°C in terms of carbon content.
36, 0,00 s, 0,275, its 3, FCC_A1 - OK -
Xsol 'LIQUID':
X(C): 0,012802399, WP(C): 0,27813585
 - OK -
37, 0,02 s, 0,28, its 4, LIQUID FCC_A1 - OK -
The first (x, y) pair is therefore (0.27813585, 0). Go to 'Global > Variables & Functions' and select the 'Variables' tab. The variable 'x' is already shown in the left-hand column. This is the StepValue, and currently has a value of 0.5.
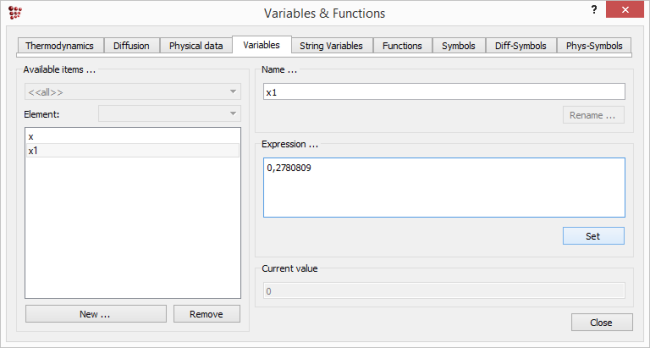
Click on 'New' and in the box, type in 'x1'. Select it (in the 'Available items' box) and type in or paste the first x-value (i.e. '0.27813585') in the 'Expression' box (confirmed by clicking on 'Set').
Add another variable 'y1'. This has a default value of zero, which does not need to be changed. The second (x, y) pair can be obtained by finding the y-value at x=0.5. Either use edit the buffer state for this composition ('Global > Buffers > Edit buffer state', click on '0,5' in the 'Buffer' box) or simply set the composition to 0.5 wt.% C and calculate an equilibrium. In both cases, the value of 'C_in_liquid' at this composition can be seen in the 'Variables' window. Go to 'View > Create New Window' and choose 'd1: List variable'. Drag and drop 'C_in_liquid' from the 'Variables' window into the new 'List variables' window which appears.
C_in_liquid +1,536325419797e-002
The numerical value can be selected and copied from this window. Re-open the 'Functions&Variables' window and add the new variables 'x2' and 'y2', equal to 0.5 and +1,536325419797e-002 in the 'Variables' tab, respectively.
The slope a and intercept b of the straight line can now be entered; a is equal to (y2-y1)/(x2-x1) and b to ((x2*y1)-(x1*y2))/(x2-x1). Create a new variable named 'a', type in the formula (or try to copy it from this tutorial) and click on 'Set'. This evaluates the expression and places the numerical value in the 'Expressions' box in the place of the formula. Do the same for 'b'. In the 'Functions' tab, the equation of the line can now be entered. Create a new function 'Liquid_line' and type '(a*x)+b' into the 'expression' box. Click 'Close' to return to the main screen.
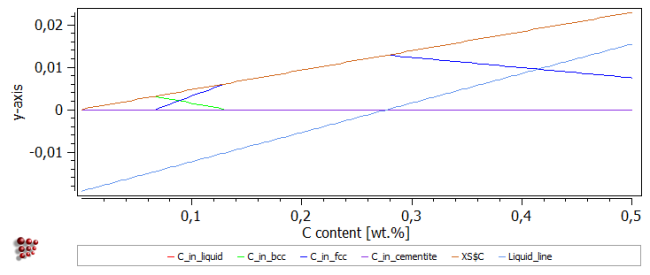
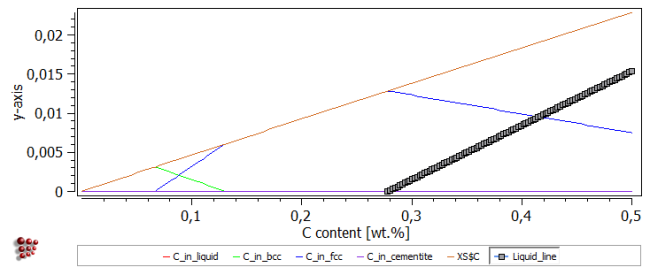
Drag the new 'Liquid_line' function from the 'Variables' window to the plot of 'C_in_liquid', etc. The resulting plot should look like this:
The 'Liquid_line' function extends to negative values, unlike the true C_in_liquid curve, which has a value of zero for carbon contents between zero and 0.27 wt.%.
One way of removing the unwanted part of this line is to select 'Edit series data' from the right-click menu. In the resulting table of 'Liquid_line' series, select all the rows for which the y-value is negative and then click on 'Delete rows/cols' to remove them. Accept the warning with 'OK'.
An alternative way is to add the series as a 'function/expression' rather than as a 'buffer result'. There are differences in the way the program treats these two types of series; for example, in a 'function/expression' series, x-values are specified as a numerical range, and the y-values are functions of x, whereas for 'buffer results', the x-values are specified as a variable (by default, the StepValue), and the y-values as another variable.
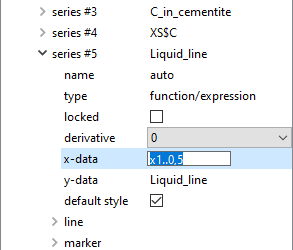
When a variable is dragged and dropped from the 'variables' window, it automatically becomes a 'buffer result'-type series. To add a 'function/expression' series, click on the plot, then in the options window, select 'new series' from the right-click menu, and choose 'function/expression'. By 'y-data' for the new series, type in 'Liquid_line'. Edit the 'x-data' line to 'x1..0.5'.
The plot should now look as shown in the image below (with the 'Liquid_line' series highlighted).
Consecutive articles
The tutorial is continued in article T7 - Calculating transformation temperatures and phase boundaries
Go to MatCalc tutorial index.
