Table of Contents
T7: Calculating phase boundaries
This tutorial was tested on
MatCalc version 6.04 rel 1.001
license: free
database: mc_fe.tdb
Complimentary files
Click here to view the script for this tutorial.
Contents
- Using “Search phase boundary” with temperature variation to determine solidus and liquidus
- Determining austenite ↔ ferrite transformation temperatures
- Finding phase boundaries for carbide phases in terms of temperature and element content
- Tracing a phase boundary on axes of temperature versus element content
It was seen in Tutorial 3 that MatCalc evaluates solubility temperatures (Tsol) or compositions (Xsol) during the course of stepped equilibrium calculations. It is also possible to calculate these individually using the 'Search phase boundary' function.
Setting up the system
Create a new workspace file and set up the system with elements Fe, C and Nb and phases FCC_A1, BCC_A2, LIQUID and CEMENTITE. Enter the composition as 0.1 wt.%C, 0.3 wt.% Nb and calculate an equilibrium at 1000°C (Refer to Tutorial 1 and Tutorial 2 if necessary.)
Note the results in the 'Phase details' window. A second FCC_A1 phase with the name 'FCC_A1#01' has automatically been created, and examination of its composition shows that its approximate formula is NbC.
#### /FCC_A1/ moles: 0,996502, gm: -62324,3 (-62324,3)
Phasestatus: entered - active
FE +9,97050e-001   C +2,92361e-003  NB +2,62256e-005

#### /FCC_A1#01/ moles: 0,00349803, gm: -114284 (-114284)
Phasestatus: entered - active
NB +5,06795e-001   C +4,93104e-001  FE +1,00592e-004


### inactive ###

#### /BCC_A2/ moles: 0, gm: -62253,7 (-62253,7)
Phasestatus: entered - not active (dfm=-81,75)
FE +9,99657e-001   C +2,87508e-004  NB +5,51873e-005

#### /LIQUID/ moles: 0, gm: -58549,4 (-58549,4)
Phasestatus: entered - not active (dfm=-3790,3)
FE +9,76688e-001   C +2,25717e-002  NB +7,40437e-004

#### /CEMENTITE/ moles: 0, gm: -52497,4 (41843,3)
Phasestatus: entered - not active (dfm=-9166,7)
FE +7,49088e-001   C +2,50000e-001  NB +9,11880e-004
It is the following line in the database file mc_fe.tdb which causes the second FCC_A1 phase to be created:
ADD_COMPOSITION_SET FCC_A1 :TI,NB,V:C,N: !
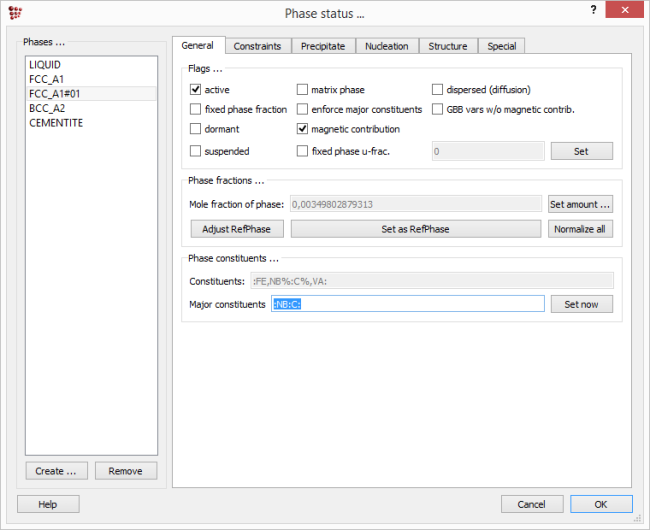
This creates that a new phase of type FCC_A1 with Ti, Nb or V as the major constituents on the first sublattice and C or N as the major constituents on the second when the system contains these elements. The 'General' tab in the 'Phase status' box ('Global > Phase status') shows the major constituents for each phase, :FE:VA: and :NB:C: respectively for FCC_A1 and FCC_A1#01.
Calculating phase boundaries
Solidus and liquidus temperatures
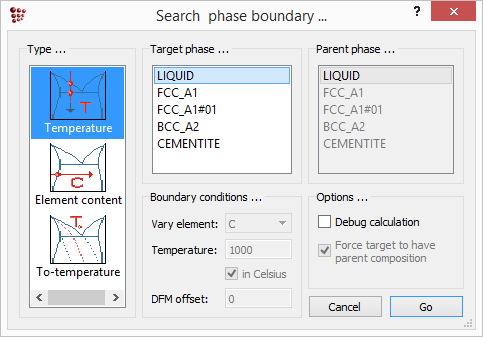
The solidus temperature is defined by zero phase fraction of liquid. To calculate this, choose 'Search phase boundary' from the 'Calc' menu or click on the  icon. The box below appears. Select 'Temperature' in the left-hand column and 'LIQUID' in the 'Target phase' column, then click on 'Go'.
The following message appears in the console window.
Tsol 'LIQUID': 1478,08 C (1751,24 K) iter: 15, time used: 0,03 s
The liquidus temperature is the dissolution temperature of the last solid phase, which in this case is BCC_A2. Selecting 'BCC_A2' as the target phase gives the following result:
Tsol 'BCC_A2': 1433,31 C (1706,46 K) iter: 13, time used: 0,02 s
Of course, this is not a liquidus temperature, as it cannot be lower than the solidus temperature. This result is given because MatCalc finds the zero phase fraction temperature of BCC_A2 phase next to the temperature of the last calculation which was 1478.08°C in this case (the liquidus temperature). Information given in 'Phase summary' window explains that at 1433.30°C, BCC_A2 appears next to FCC_A1 phase (inactive BCC_A2 phase has the driving force value of zero). It is recommended to look at the 'Phase summary' window in order to check if the found phase boundary is the desired one!
The liquidus phase can be easily found if an equilibrium calculation in the liquid system is performed first. Calculate an equlibrium at 1600°C (or any temperature in which system contains only a liquid) and search again for the phase boundary of BCC_A2 phase. This time the following result should be given:
Tsol 'BCC_A2': 1527,58 C (1800,73 K) iter: 4, time used: 0,02 s
In general, the correct phase boundaries are found if the initial equilibrium describes the system in the neighbouring phase field which does not contain the searched phase - in the case presented above, the liquidus temperature (which is phase boundary of 'BCC_A2') was found from the 'LIQUID' phase field. Also, the algorithm used to search for phase boundaries might fail to converge if the starting point is too far away from the boundary.
Austenite-ferrite transformation temperatures
Low-alloy steels undergo a ferrite - austenite phase transformation between 700 and 800°C (see, for example, Tutorial 4). To find the exact temperatures of the transformation in the Fe-0.1wt.%C-0.3wt.%Nb system, calculate an equilibrium at 700°C and use again 'Search phase boundary'. Select 'FCC_A1' as a target phase to identify the zero-phase boundary temperature for austenite.
Tsol 'FCC_A1': 726.53 C (999.68 K) iter: 5, time used: 0.02 s
The zero-phase boundary of BCC_A2 for this transformation can be identified by calculating an equilibrium at 900°C and then searching for the boundary.
Tsol 'BCC_A2': 883,62 C (1156,77 K) iter: 5, time used: 0,02 s
Dissolution temperatures of carbides
Cementite is only stable to relatively low temperatures, so calculate an equilibrium at 800°C as a starting point, then search for the phase boundary.
Tsol 'CEMENTITE': 726,53 C (999,68 K) iter: 9, time used: 0,02 s
Note that this is the same temperature as the zero-phase boundary of FCC_A1. Niobium carbide, by contrast, remains stable at higher temperatures. Calculate an equilibrium at 1500°C before searching for the boundary.
Tsol 'FCC_A1#01': 1434,70 C (1707,85 K) iter: 16, time used: 0,05 s
Element content for zero-phase fractions
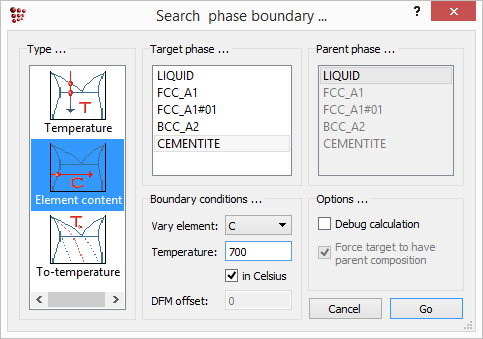
Phase boundaries can also be found in terms of element content at a fixed temperature. To illustrate this, the zero-phase boundary of cementite at 700°C will be evaluated in terms of carbon content. Calculate an equilibrium at 700°C, then open the 'Search phase boundary' box and select 'Element content' in the left-hand column. Set the target phase to 'CEMENTITE', the element to be varied to 'C', and the temperature to '700', then click 'Go'.
The output gives the carbon content for zero phase fraction of cementite in mole fraction and in weight percent.
iter: 2, time used: 0,03 s, GibbsEnergy: -40689,85 J
X(C): 0,0024753954, WP(C): 0,053278076, T:  700 C (973,15 K) - OK -
Note: After the search for the phase boundary with element content variation, the composition of the system is changed to the found value! (check 'Global > Composition')
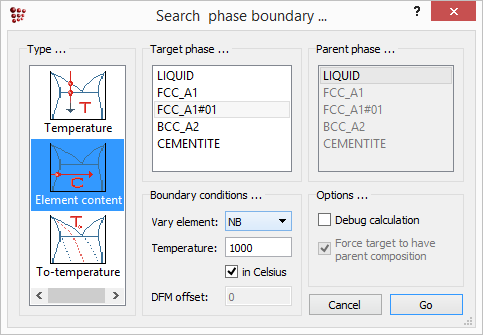
In the same way, the zero phase fraction boundary for niobium carbide at 1000°C can be evaluated in terms of the niobium content. Firstly, open 'Global > Composition' and reset the carbon content to 0.1 wt.%. Calculate an equilibrium at 1000°C, then search for the phase boundary for 'FCC_A1#01', this time setting the element to be varied to 'Nb'.
The output in the console shows the Nb content above which the carbide phase is thermodynamically stable.
iter: 7, time used: 0,03 s, GibbsEnergy: -62313,505 J
X(NB): 1,7312596e-005, WP(NB): 0,0028905809, T: 1000 C (1273,15 K) - OK -
Tracing phase boundaries
Once a point on a phase boundary has been identified using the process described above, the boundary can be traced as a function of element content. In the following example, the effect of the niobium content on the temperature of the FCC_A1#01 (NbC) zero-phase boundary will be calculated.
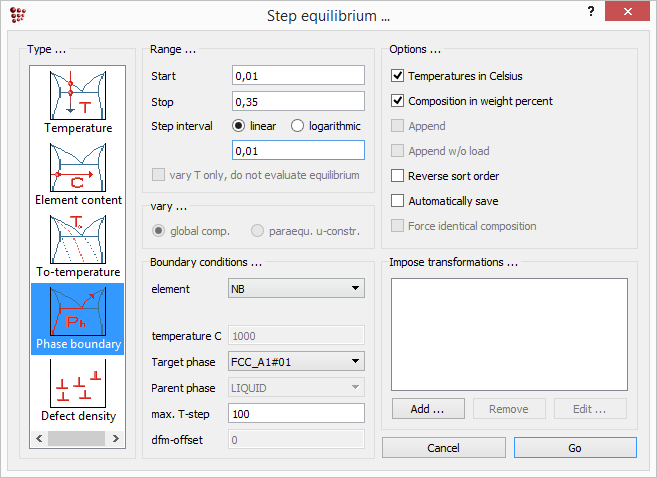
Having established the zero phase fraction boundary for niobium carbde at 1000°C, open the 'Step equilibrium' window using 'Calc > Stepped calculation' and select 'Phase boundary' from the left-hand column.
In the 'Boundary conditions' box, set the element to 'Nb', the target phase to 'FCC_A1#01' and the max. T-step to '100'. (The use of this parameter will be discussed in Tutorial 8) Enter '0.01', '0.35' and '0.01' as the start, stop and step interval values in the 'Range' box. Click on 'Go' to perform the calculation
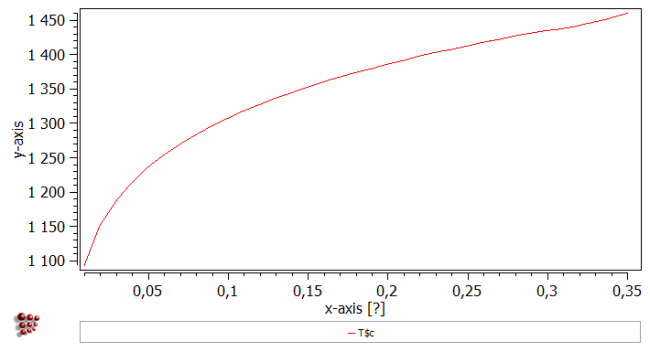
Create a new X-Y plot window (Tutorial 4) and drag and drop 'T$c' (from 'favorites' category in variables window) into it. The plot should look like this:
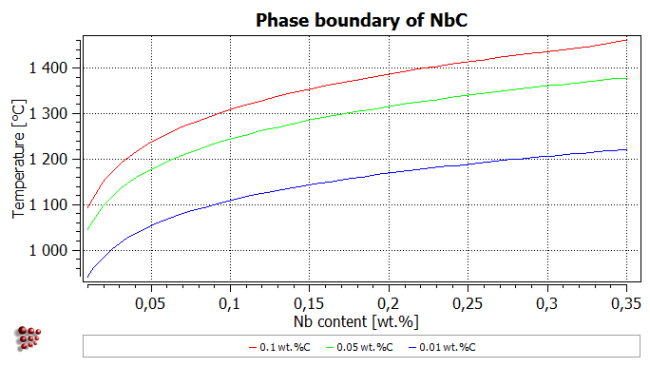
Right-click in the plot window outside the plot area and choose 'Duplicate and lock series' from the window (see Tutorial 5). Double-click on the name of the series to duplicate it. In the 'Options' window, change the name of the original series ('*_T$c') to '0.1 wt.%C'.
Change the carbon content of the system to 0.05 wt.% C, calculate an equilibrium at 1000°C and search again for the same phase boundary, then make a stepped calculation using the same conditions as before. The phase boundary for 0.05 wt.% C should follow the green curve in the plot below, which also shows the same phase boundary for 0.01 wt.%C - as an exercise you can try to format the plot as shown below.
Consecutive articles
The tutorial is continued in article T8 - Calculating a phase diagram in a binary system
Go to MatCalc tutorial index.
