Table of Contents
Example E6: Composition-dependent driving forces for carbide precipitation in Fe-C-Cr
Compatibility
MatCalc version: 5.44.1002
Database: mc_sample_fe.tdb
Author: Georg Stechauner
Created: 2012-01-04
Revisions:
Objectives
This example investigates the influence of Cr on the driving force for nucleation of cementite. The procedure of evaluating driving forces is demonstrated by setting the phase fraction to zero and fixing the phase fraction in the phase status dialog.
The u-fraction, which will be extensively used in this example, is defined as the site fraction of an element with reference to the substitutional sublattices only. The interstitial elements are not taken into account in the normalization. The sum of all u-fractions of substitutional elements is unity.
Example: (Fe,Cr)3C cementite is a stoichiometric compound with an Fe+Cr:C ratio of 3:1. Expressed in mole fractions, this means: 0.75 moles of atoms on the substitutional sublattice, and 0.25 on the interstitial one. Converted to u-fraction gives $u_{Cr}+u_{Fe}=1$ on the first sublattice, while the u-fraction of C is 0.33 on the second sublattice. By varying the u-fraction of Chromium from 0 to 1, all different kinds of cementite with respect to the Cr to Fe ratio can be obtained, ranging from pure Fe3C to pure Cr3C.
Related documents
none
Complementary files
Click here to view the script for this tutorial.
Main document
Setup thermodynamics
Start by setting up the thermodynamics. Use one of the above listed databases and select the elements Fe, C and Cr and the phases BCC_A2 and CEMENTITE.
Start with a chemical composition in weigth percent as shown below:
| C | Cr |
|---|---|
| 0.005 | 3.0 |
Start the simulation by setting automatic start values. Calculate an equilibrium at 500C.
Theoretical excourse: Evaluation of driving forces
Between two heat reservoirs, exchange processes will occur if the temperature of the two reservoirs is different. The heat flux goes to zero, if the temperature difference between the reservoirs goes to zero. Analogously, a mass flow occurs in thermodynamic systems consisting of various chemical elements, if the chemical potential of all elements differs in the individual phases. This mass flow often leads to a phase transformation, which is an internal process with the goal of minimizing of free energy by maximizing entropy. The entropy change is related to the driving force as
\[ D = T \frac{dS}{dξ}, \]
where $D$ is the driving force, $T$ is temperature, $dS$ is the change of entropy and $dξ$ is a placeholder for any of the free system parameters, e.g. radius, chemical composition, … with (0 ≤ ξ ≤ 1). Since temperature is always a positive quantity, and $dS≥0$ for a spontaneous process, $D$ must also be > 0. Consequently, if $D≤0$, a process will not occur spontaneously, no matter how long one waits.
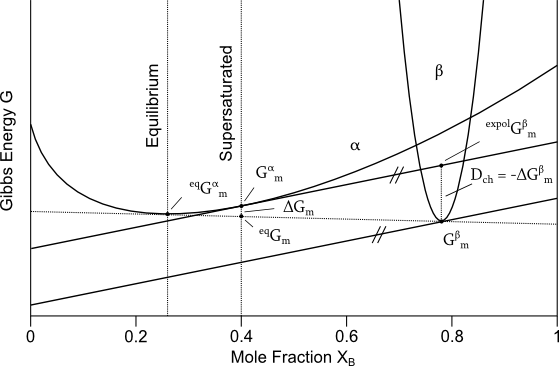
Consider now a supersaturated solution with an overall composition of $X_B\ge0.4$. As shown in the figure below, initially, this composition has a Gibbs energy of $G^α_m$, which is not the lowest possible energetic state for this system, as indicated by the point $^{eq}G_m$. The lowest Gibbs energy is found with the 'Common Tangent Method', where a tangent is constructed touching the Gibbs energy curve of the phases being in equilibrium. The available amount of energy, which can be decreased by the phase transformation, is give by
\[ ΔG_m = \ ^{eq}G_m - G^α_m .\]
Analogously, the driving force can be constructed, with the help of the extrapolated Gibbs energy $^{expol}G^β_m$. This point characterizes the change of chemical composition of a matrix crystal, without changing either its chemical potential or its crystal structure. Arriving at the point $^{expol}G^β_m$, a transformation from α → β crystal structure occurs, lowering the Gibbs energy to $G^β_m$. For a phase transformation, the placeholder variable ξ is determined by the number of moles of new phase formed $N^β$. Using formula one, and constant temperature, pressure and moles (that is: $TdS = G$), this leads to
\[ D = - \Bigl( \frac{δG}{δN^β} \Bigr)_{T,P,N} = -ΔG^β_m . \]
Hence, the driving force is given as the change in Gibbs energy due to nucleation of beta phase, which can be constructed as the difference of extrapolated $^{expol}G^β_m$ and the molar Gibbs energy $G^β_m$ of β.
Evaluating driving forces
In this section we are going to play around with all kinds of settings to show driving force curves. To obtain the results presented below, be sure to have a carbon content of 0.005 wt-%.
Important note …
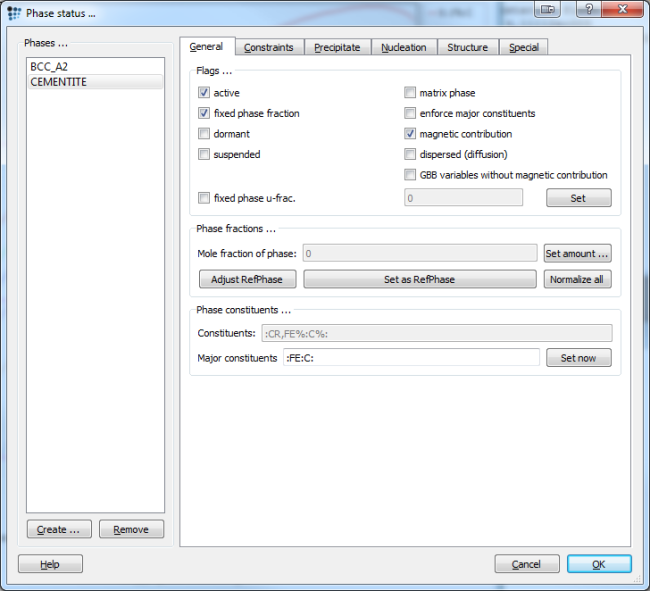
To do so, check the 'fixed phase fraction' box in the phase status dialog, and make sure that the phase fraction of cementite is zero. If not, use the 'set amount' button to manually change the mole fraction.
After calculating an equilibrium at 800C, the 'phase details' window looks like:
Cementite not fixed to 0:
-------------------------
#### /BCC_A2/ moles: 1, gm: -48042.9 (-48042.9), sff: 0.999768
Phasestatus: entered - active
FE +9.67623e-001  CR +3.21446e-002   C +2.31925e-004


### inactive ###

#### /CEMENTITE/ moles: 0, gm: -47846.1 (33892.5), sff: 0.25
Phasestatus: entered - not active (dfm=-2261)
FE +3.97480e-001  CR +3.52520e-001   C +2.50000e-001


Cementite fixed to 0:
---------------------
#### /BCC_A2/ moles: 1, gm: -48042.9 (-48042.9), sff: 0.999768
Phasestatus: entered - active
FE +9.67623e-001  CR +3.21446e-002   C +2.31925e-004

#### /CEMENTITE/ moles: 0, gm: -47846.1 (33892.5), sff: 0.25
Phasestatus: fixed
dfm: -2261
FE +3.97480e-001  CR +3.52520e-001   C +2.50000e-001


### inactive ###
The output above shows the phase details window and two major features of the simulation. First, the driving force is negative at a temperature of 800C (dfm=-2261 J/mol), hence nucleation of cementite will never occur. The second feature is that, as soon as the phase is fixed, its status changes from 'inactive' to 'active' and it is displayed in a different section.
Performing the same step at 600C, the output of the phase details will look different:
Cementite not fixed to 0:
-------------------------
#### /BCC_A2/ moles: 0.999118, gm: -34667.6 (-34667.6), sff: 0.999989
Phasestatus: entered - active
FE +9.68347e-001  CR +3.16421e-002   C +1.14358e-005

#### /CEMENTITE/ moles: 0.000881997, gm: -38776.5 (28409.4), sff: 0.25
Phasestatus: entered - active
CR +6.01431e-001   C +2.50000e-001  FE +1.48569e-001


### inactive ###


Cementite fixed to 0:
---------------------
#### /BCC_A2/ moles: 1, gm: -34667.8 (-34667.8), sff: 0.999768
Phasestatus: entered - active
FE +9.67623e-001  CR +3.21446e-002   C +2.31925e-004

#### /CEMENTITE/ moles: 0, gm: -38785.8 (28433.2), sff: 0.25
Phasestatus: fixed
dfm: 5473.9
CR +6.02619e-001   C +2.50000e-001  FE +1.47381e-001


### inactive ###
The driving force can be read as the 'dfm' value. For the case of not fixing the phase fraction, no useful dfm-value can be read from the output window, as it will be zero.1) Upon fixing the phase fraction of cementite to zero and repeating the equilibrium simulation, a positive driving force is observed in the phase status window.
Important note …
The validity of these conditions are easily verified when drawing 'non-parallel' tangents and then investigating the resulting driving forces.
Evaluating compositionally constrained driving forces
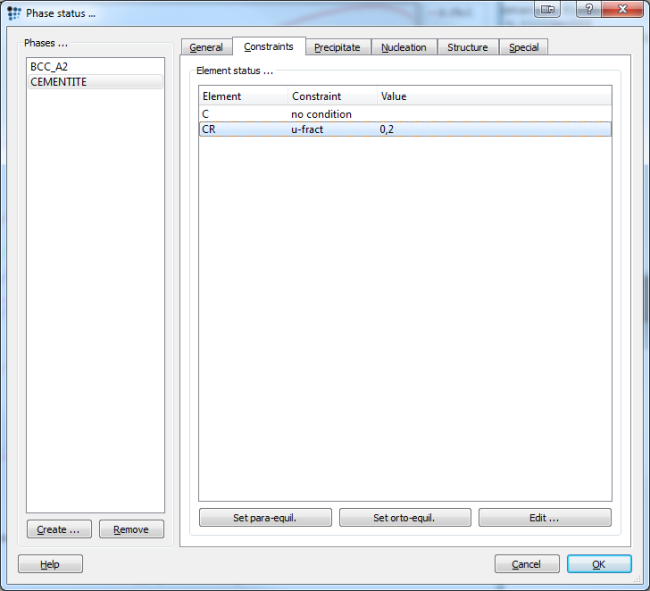
Switch to the constraints tab in the 'phase status' dialog, select the cementite phase and set a u-fraction constraint for chromium of 0.2. In any of the following (constrained) equilibrium calculations, MatCalc will fix the Cr u-fraction in the cementite phase to this value. Since the composition of a phase is thus restricted, this type of equilibrim is also called compositionally constrained equilibrium.
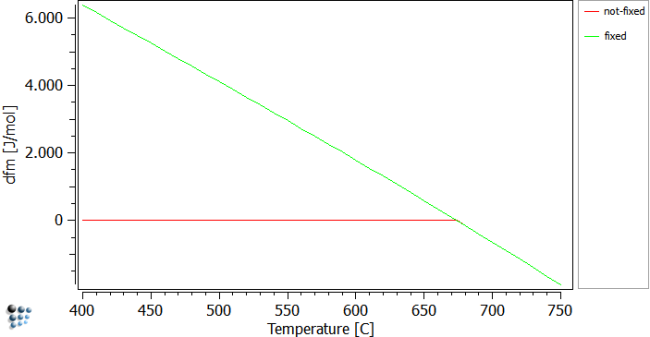
The figure below shows the driving forces of cementite over temperature. Perform a stepped calculation with stepping temperature in the shown range to obtain the given figure. The fixed case shows the driving force (dfm), when the phase fraction is fixed to zero, the 'not-fixed' one shows the curve for cementite being in equilibrium with bcc_a2. It is easy to perceive that, at a temperature of about 680C, the cementite phase becomes stable and its phase fraction increases. Simultaneously, the driving force of this phase becomes zero.
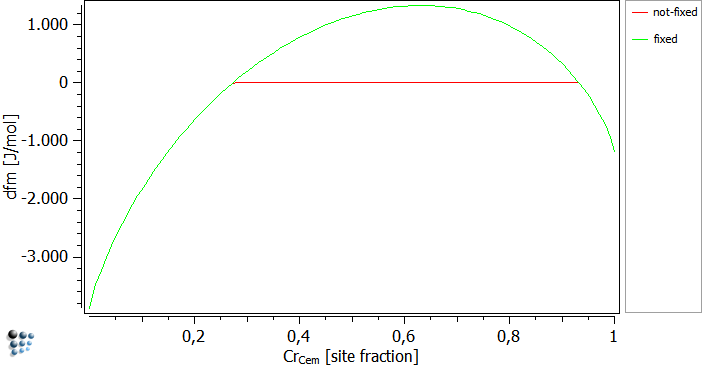
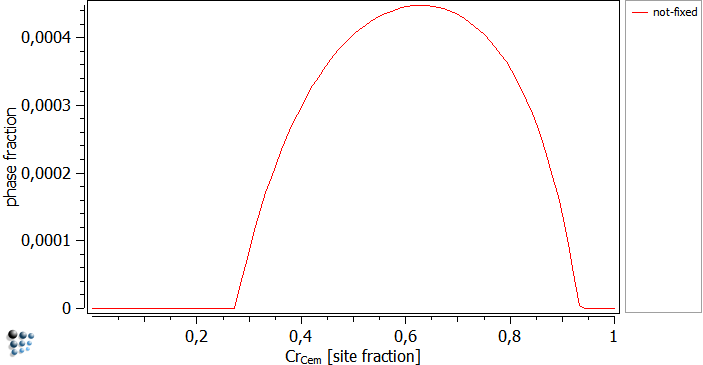
The next figure shows the calculated driving forces over the chromium site fraction. Perform a stepped calculation with Cr as the varying element content in a range from 0 to 1. Pick a sufficiently small step interval (e.g. 0.01) and select to vary the paraequilibrium u-constraint, …
… instead of the global composition. In this case, MatCalc looks for any given para-equilibrium constraint in terms of u-fractions, and will vary these values instead of the global chemical composition. The figures below were calculated at a temperature of 700C. The driving forces are plotted over the site-fraction of Cr in cementite. The fixed curve has a positive driving force for chromium values of 0.3 to about 0.95. Together with the next figure, it can be seen that the not-fixed curve nucleates in this region.
Influence of carbon on driving forces
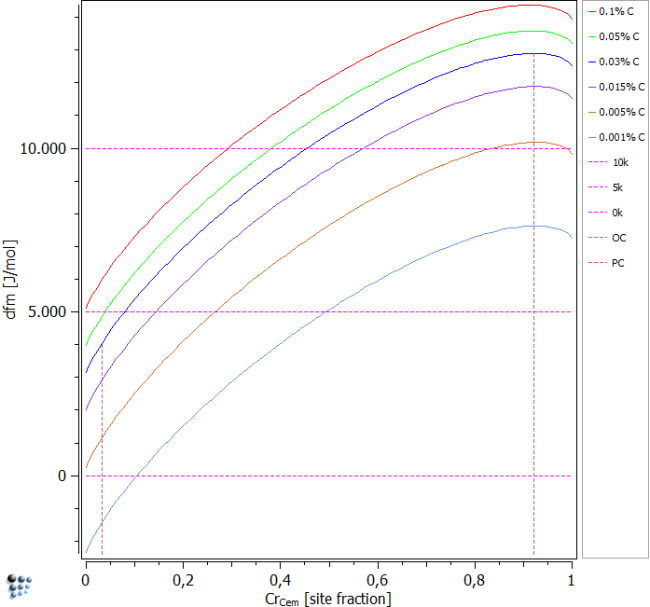
This section shows the driving forces of cementite as a function of cementite Cr content displayed in terms of the u-fraction variable. Different C contents are plotted to visualize the effect on the driving forces. It is obvious that sufficient amount of C is needed for the nucleation of cementite. This permits the reverse conclusion that less C induces lower driving forces.
Select a carbon content of 0.1 wt-% to begin with, and perform a stepped calculation for varying element content. Choose chromium to be the varying element and select, just like above, to vary the paraequilibrium constraint. Furthermore, choose 'range' and 'step width' as before. After plotting and locking each curve, change the carbon content as shown below and repeat the calculation.
The assumption stated above is clearly visible from the figure. The lower the C content is, the lower is the driving force for cementite nucleation. However, only for a very low value of 0.001% carbon, nucleation will not occur for small chromium values. In all other conditions, cementite nucleation is thermodynamically possible. PC and OC represent the paraequilibrium composition and the ortho-equilibrium composition, respectively. They are valid for the blue 0.03% C line only, as they are dependent on the supersaturation.
Consecutive articles
none
