Table of Contents
Example D30: Diffusion of aluminium in ferrite and austenite
Compatibility
MatCalc version: 5.44
Author: G. Stechauner
Created: 2012-01-31
Revisions:
Objectives
This example shows how to plot the diffusion coefficient of a certain phase over the temperature in an Arrhenius plot. It will be shown how to modify the variables in order to account for different elements. Some experimental data will be provided within the results.
This example is quite sophisticated and is not aimed at the beginning user. Be sure to familiarize with other examples before attempting this example. The Functions & Variables window will be used extensively.
Related documents
None
Main document
Consider pure iron with tracer amounts of aluminium. To set the system up, select BCC_A2 (ferrite) and FCC_A1 (austenite) as the phases and a low amount of Al (e.g. 0.01 wt-% ). Don't forget to load the diffusion data. By choosing such a low amount of Al we ensure that only Al in Fe-matrix diffusion occurs, and not the other way around.
Investigate the system
Start off by setting automatic start values and calculate an equilibrium at 900C. Continue by performing a stepped equilibrium calculation in a range fromm 400 to 1000C.
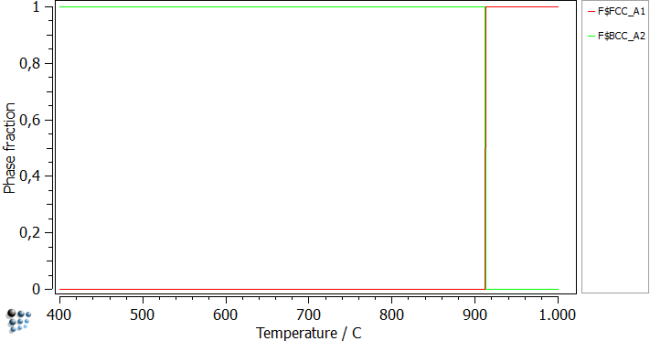
After plotting the phase fractions, you can see the transformation from austenite to ferrite at 913 C. Note this temperature as it will be needed later on.
Setup diffusion diagram
Create a new p1 plot an perform the following changes to the plot:
| Default x-data | 10000/T |
|---|---|
| x-axis title | 10000/T |
| y-axis title | Diffusion coefficient m2/s |
As we already performed the stepped calculation, can continue with plotting the diffusion coefficients of Al. To do so, move the DT$FCC_A1$AL entry (Variables - diffusion - DT$*$*) to the plot. Repeat this for the BCC_A2.
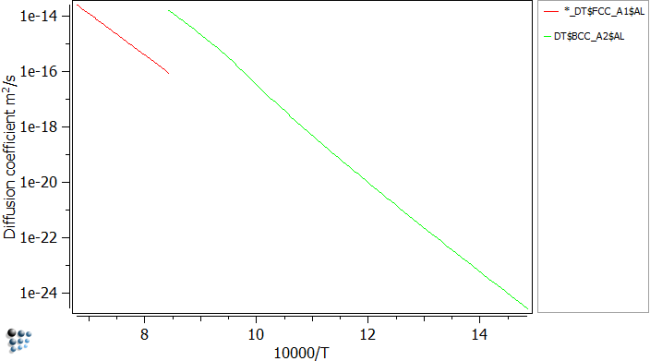
The whole temperature range is now plotted, however this is not correct, as austenite is not found a low temperatures and ferrite vice versa. To circumvent this problem, perform a stepped calculation from 1200C to 913C, where the transformation occurs and plot the diffusion data for FCC. Continue by stepping from 913 to 400C and plotting BCC data.
The diffusion of Al in Fe can be then seen like in the figure above.

