This is an old revision of the document!
Table of Contents
T22: Recrystallization on subgrain boundaries
This tutorial was tested on
MatCalc version 6.02 rel 1.003
license: free
database: mc_fe.tdb; mc_fe.ddb
Complimentary files
Click here to view the script for this tutorial
Contents:
- Activation of recrystallization model
- Kinetic simulation of recrystallization process
Deformation of the material introduces new dislocations into the microstructure. These surplus dislocations will create the substructure by ordering themselves into the subgrain walls during the recovery process. MatCalc includes a model describing the transformation of the newly subgrains into the new recrystallized grains, as described by Buken et al. This tutorial shows the procedure to activate the recrystallization model, presents the typical result of the recrystallization kinetics simulation and discusses the output values of the parameters obtained during the simulation.
Setting up the system
Create a new workspace and open the 'mc_fe.tdb' database. Select the elements 'Fe' and 'C', together with the 'FCC_A1' phase. Click on 'Read' instead of 'Read & Close', as the subsequent step is to read the diffusion database in this window. Select 'Diffusion data' on the left side and read the 'mc_fe.ddb' database. Enter the composition of 0.2 wt.% C. Click on 'Set start values' and calculate an initial equilibrium at 1200°C.
Precipitation domains and phases
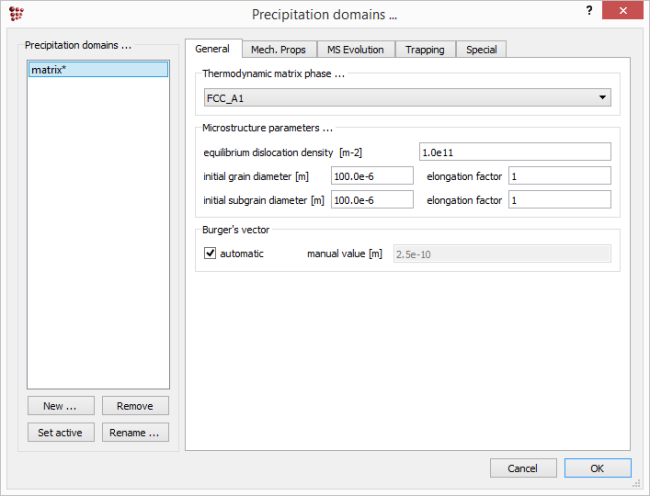
Create a precipitation domain called 'matrix' in the 'Precipitation domains …' window. Select FCC_A1 as the thermodynamic matrix phase.
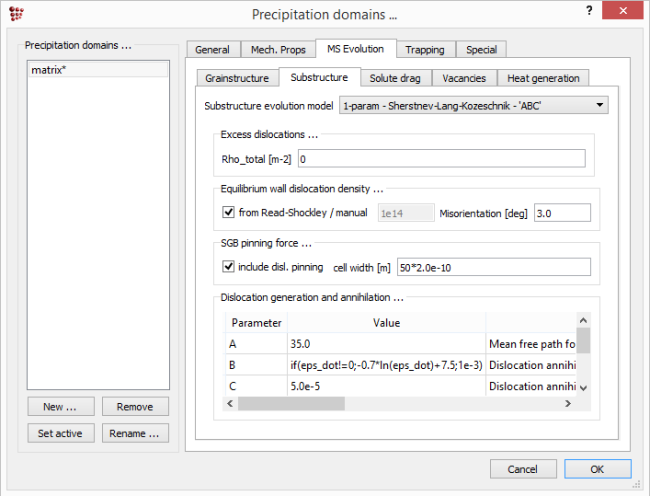
In the current recrystallization model, the newly recrystallized grains form from subgrains created during the recovery process following the material deformation. So first, the subgrain formation and size evolution will be investigated. The subgrains are generated by the ordering of the excess dislocations introduced during the deformation process. Hence, the first thing to do will be to activate the substructure evolution model. Switch to the 'MS Evolution' tab, select 'Substructure' tab inside and choose '1-param - Sherstnev-Lang-Kozeschnik - 'ABC' ' as the model for the substructure evolution.
In this tutorial, the default model parameters will be used for the demonstration so click on 'OK' to close this window.
Thermo-mechanical treatment
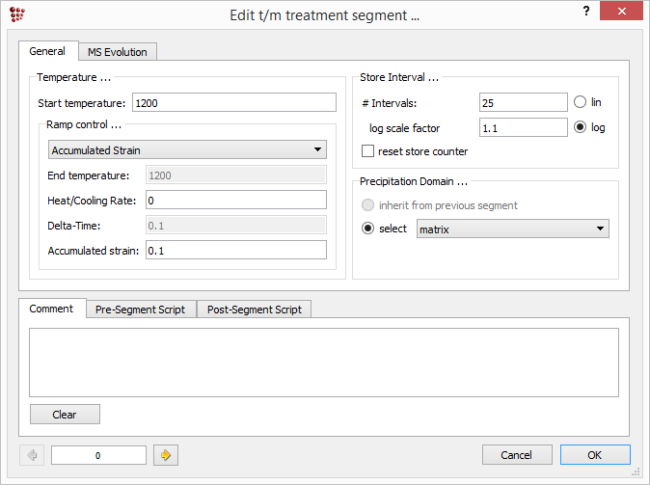
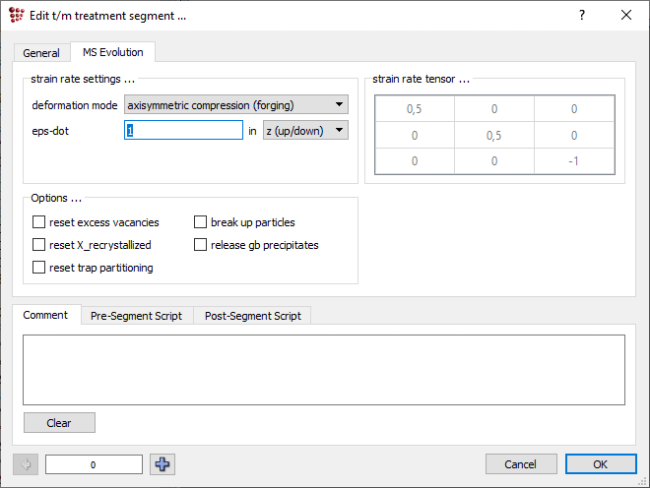
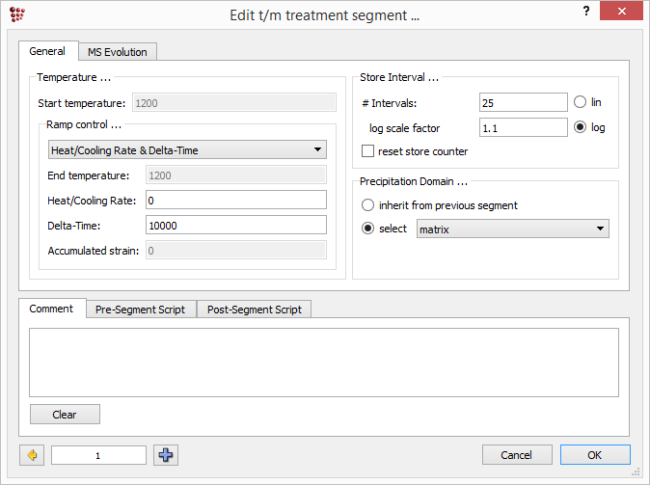
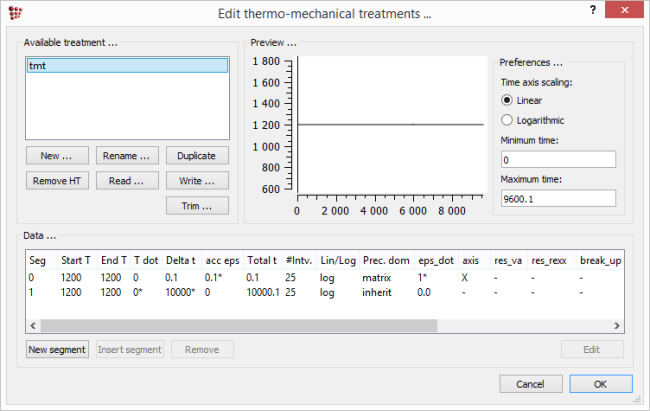
Now, define the thermo-mechanical treatment which will consist of the deformation segment and the subsequent annealing segment. For the sake of simplicity, the whole simulation will be performed at the constant temperature of 1200°C. In 'Global' → 'Thermo-mech. treatments …' create a new treatment with the name 'tmt'. Next, create a segment in which the austenite domain will be deformed to the accumulated strain value of '0,1'. In 'MS Evolution' tab, set the 'eps-dot' (strain rate) value to '1'. Back in 'General' tab, the 'Start temperature' is to be set to '1200°C'.
In the next segment, the material will be held isothermally at 1200°C. Select “Heat/Cooling Rate & Delta-Time” in “Ramp control” field and set the rate to '0' and the segment time to '10000' seconds.
The settings for the whole treatment are summarized below.
Close the editor window by clicking 'OK'.
Kinetics simulation of the deformation process
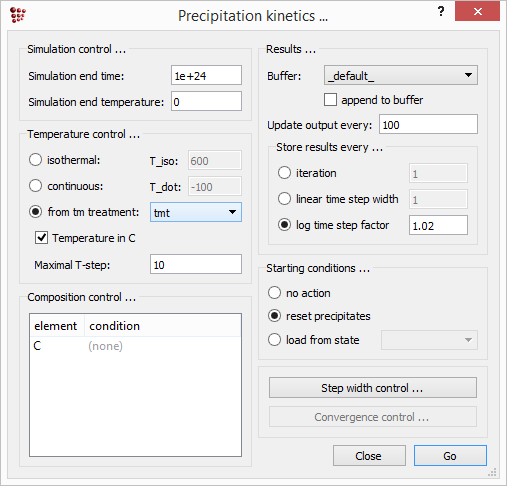
With all the setup procedures done, perform the kinetics simulation. Click on 'Calc' → 'Precipitation kinetics'. Select the 'tmt' treatment in the 'Temperature control …' area and click on 'Go'.
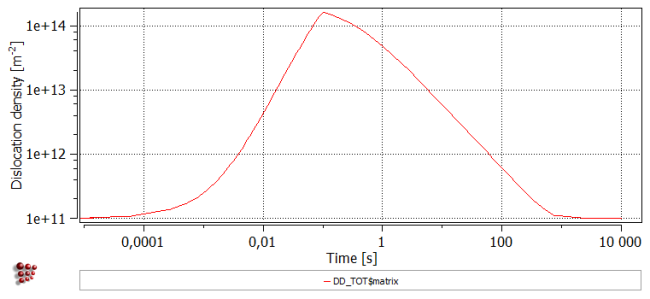
Once the calculation is completed, create a plot visualizing the dislocation density. In menu 'View', click on 'Create new window…' and select '(p1) Plot core: XY-data' plot type. Drag and drop 'DD_TOT$matrix' variable which is located in the 'prec_domain struct sc' group in 'variables' window. Set the x- and y-axis to logarithmic scale and start the x-axis scaling at 1e-5. Rename the x-axis to 'Time [s]' and the y-axis to 'Dislocation density [m-2]'. Switch on the major grids for both axes.
As might be expected, the plot shows an increase of the dislocation density during the deformation segment which lasts up to 0,1 second. Afterwards, the dislocation density falls down to Equilibrium value which corresponds to the recovery process during the subsequent isothermal holding at 1200°C. In order to investigate the effect on the size of the forming subgrains, create a new plot depicting the 'SGD$matrix“' variable which represents the subgrain diameter. 'SGD$matrix' variable can be also found in the 'prec_domain struct sc' group.
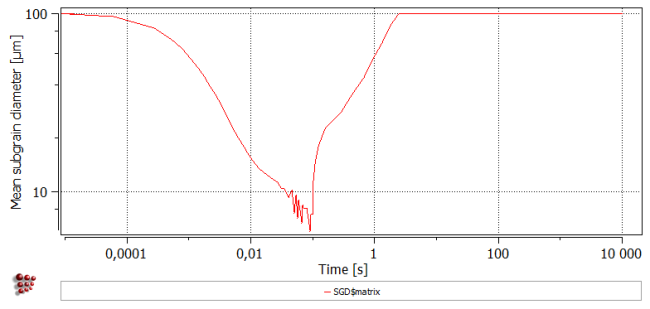
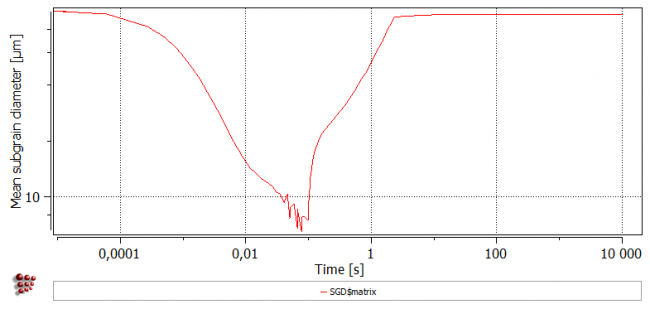
The subgrain diameters drops initially from about 100 micrometers down to about 7 micrometers at 0,1 seconds. Afterwards, it rises again reaching the initial value. The stage of subgrain decrease is not to be interpreted directly, as the subgrains are formed during recovery rather than during deformation stage. It is a consequence of the MatCalc setting which sets the initial value of subgrain diameter equal to the initial value of the grain diameter. Then, the subgrain size is calculated inversely to the square root of the dislocation density, in accordance with the similitude principle. As the recovery process starts, it is assumed that the subgrains are immediately formed with the predicted size of 7 micrometers. These subgrains grow afterwards in a similar way as the grains would do - there is a model which correlates the growth rate with the inverse of the subgrain diameter. During the recovery step, the rising subgrain size corresponds to the falling dislocation density. After almost 3 seconds, the subgrain size reaches the initial value of 100 micrometers and cannot grow further as the limiting grain size remains at this value.
Introducing grain growth
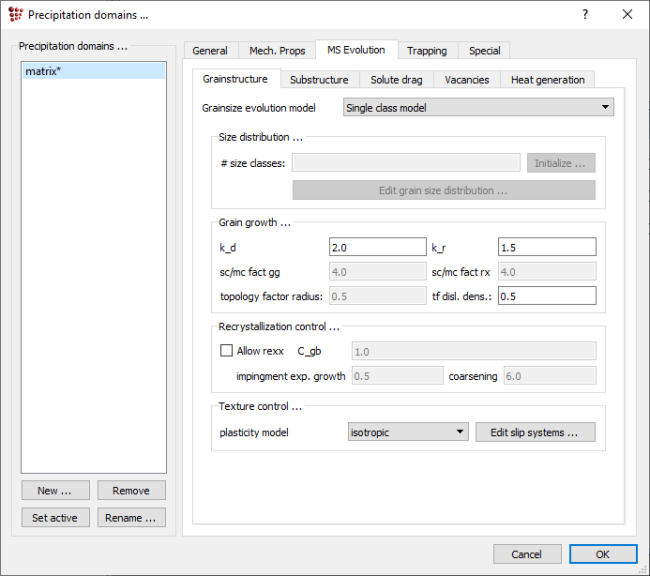
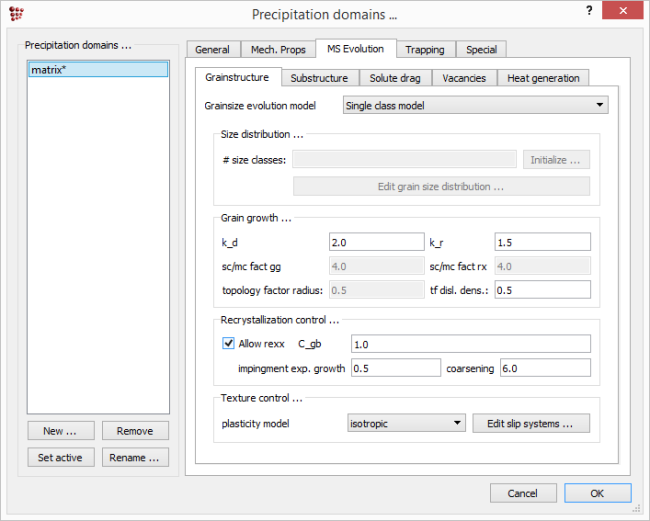
In the next simulation, the grain growth model will be activated, so that the constraint on the subgrain growth will be removed. In 'Precipitation domains' window, select the 'MS Evolution tab' and click on 'Grainstructure' tab there. In the field 'Grainsize evolution model' select 'Single class model'. Leave all parameters on default value.
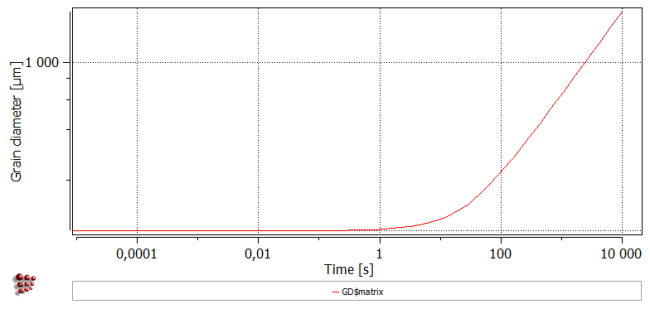
By clicking on 'Global' → 'Buffers' → 'Rename', rename the current buffer to 'deformation_only'. Next, in 'Global' → 'Buffers' click on 'Create' and name the new buffer as 'deformation&growth'. Create a new plot showing the grain diameter. Rename the y-axis to 'Grain diameter [<html>μm]', set the factor to '1e6' and switch the y-axis to logarithmic type. Drag and drop the variable 'GD$matrix' on the plot. At the moment, only a straight line is visible, as the grain growth was kept constant in the last simulation. Right click on the plot and click on 'Duplicate and lock all series'. Afterwards, repeat the calculation by clicking on 'Calc' → 'Precipitation kinetics…' and clicking 'OK' in the appearing window.
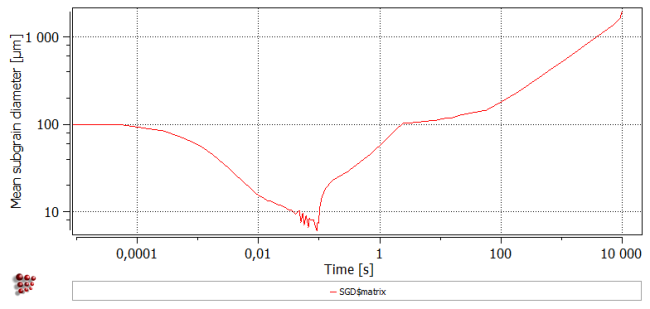
After the calculation is done, switch the buffer relevant to the plots to the current one. In the 'options' window, select 'deformation&growth' in the 'core buffer' field. One can immediately notice the difference in the curves at the recovery stage. Increasing grain diameter allows for the further growth of the subgrains.
Introducing recrystallization
It is time to activate the recrystallization model. In 'Precipitation domain' window, select again the 'MS Evolution' and 'Grainstructure' tab there. In the 'Recrystallization control…' section put a checkmark in 'Allow rexx' field.
In 'Global' → 'Buffers' click on 'Create' and create a new buffer named 'Recrystallization'. Next, create three more plots in the plot window. Use the following y-axis settings for the plots:
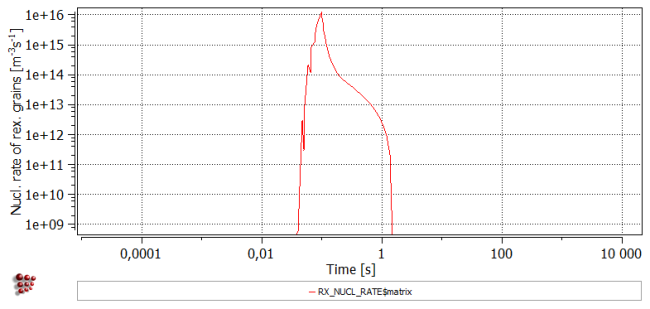
- Title: Nucl. rate of rex. grains [m-3s-1], type: log
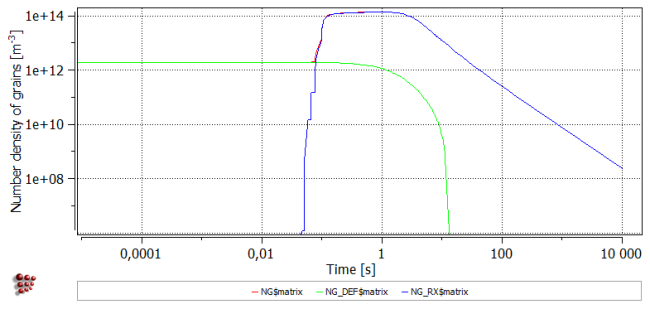
- Title: Number density of grains [m-3], type: log
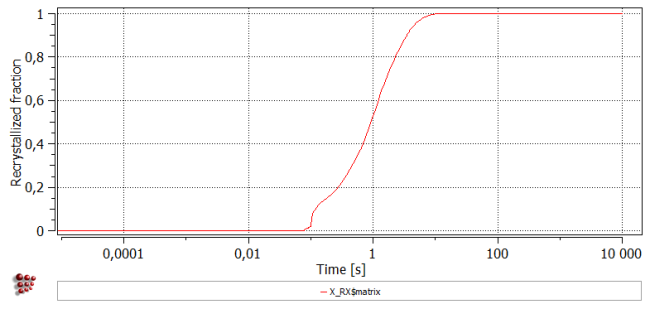
- Title: Recrystallized fraction
Drag and drop the following series on the plot:
- 'RX_NUCL_RATE$matrix' (can be found in 'prec_domain ms evolution' variables group)
- 'NG$matrix', 'NG_DEF$matrix', 'NG_RX$matrix' (can be found in 'prec_domain struct sc' variables group)
- 'X_RX$matrix' (can be found in 'prec_domain struct sc' variables group)
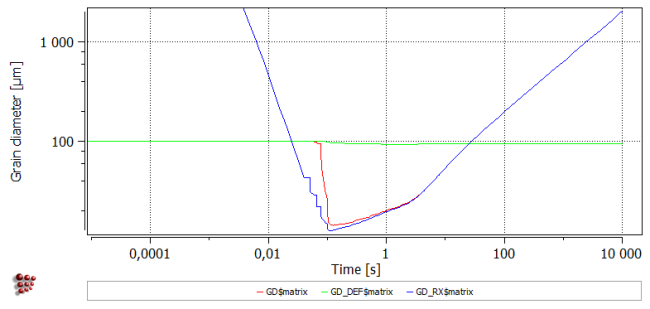
Additionally, add the series 'GD_DEF$matrix' and 'GD_RX$matrix' to the plot of grain diameters.
With all these plots present, perform once again a kinetic simulation. Once it is completed, a picture of the recrystallization progress in the system is available. Looking at the last plot of recrystallized fraction for the matrix, one can notice that the structure is fully recrystallized. The process seems to happen between the 0,1 and 10 seconds.
Looking on diagram showing the grain number densities, one can notice that the “old” microstructure of the deformed grains, represented with the variable 'NG_DEF$matrix', with the initial density of slightly above 1e12 m-3 decreases gradually and vanishes at the end of the recrystallization process. The curve representing the number of the recrystallized grains (variable 'NG_RX$matrix') appears already before 0,1 seconds and grows fast, showing a maximum value at about 1e14 m-3 and then continues to decrease to the end of the simulation. This analysis is supported by the plot of nucleation rates of recrystallized grains, which shows that the nucleation phase for the recrystallized grains starts around the time of 0,05 seconds and lasts to about 1,5 seconds. The end of the nucleation phase coincides obviously with the maximum observed for the number density of the recrystallized grains. The total number density of grains, represented by the variable 'NG$matrix' is just a superposition of the two previous values
The plot representing the grain diameter (with y-axis scaling limited to 2000 micrometers) gives some further information. The curve 'GD_DEF$matrix' representing the size of the deformed (“old”) grains initializes at 100 micrometers. The curve 'GD_RX$matrix' representing the size of the recrystallized (“new”) grains initializes at some high value and decreases down to about 13 micrometers. Obviously, a physical interpretation for the recrystallized grain size is reasonable only for the process time when such grains are present at all, i.e. once the number density of recrystallized grains gets a positive value. The mean value for the grain diameter observed in the microstructure ('GD$matrix' curve) decreases gradually from the deformed value towards the recrystallized value. Growth process of the recrystallized grain can be observed after the deformation process ends. On the contrary, the diameter of the deformed grain decreases a little, as these grains are “consumed” by the newly formed structure. Of course, there is again no interpretation possible for the deformed grain size for the simulation time with zero number density of these grains. Once the microstructure is fully recrystallized, a grain growth is observed. This coincides with the reduction of the nucleation density representing an occurrence of the grain impingement.
Interestingly, the results for the subgrain size and dislocation density are similar to the ones obtained in the simulation without grain growth. The subgrain size seems to be limited again short below 100 micrometers and the dislocation density remains steady at the according value. To interpret this outcome correctly, one needs to keep in mind that the subgrains are assumed to exist only in the deformed grains in the applied single class model. The first consequence of this fact is that the interpretation of the calculated subgrain size is relevant only for the time periods when the deformed grain is present in the system, i.e. till the microstructure is fully recrystallized. The other consequence is the limitation of the subgrain size which cannot get a value greater than the size of the deformed grain. As the deformed grain size did decrease during the simulation, the subgrain size growth also stops around 95 micrometers.
Consecutive articles
The tutorial is continued in article T23 - Introduction to cell simulations: long-range diffusion.
Go to MatCalc tutorial index.
