Table of Contents
FAQ - User defined plots
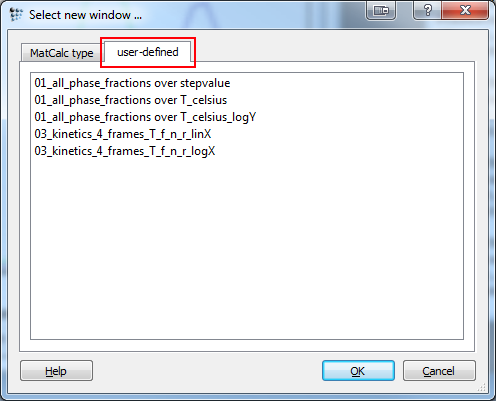
This FAQ covers the 'user defined' windows, which can be selected in the 'Select new window' ('Ctrl' + 'M') dialog.
Diagnosis
- An additional user-defined window is needed, but no 'create user-defined' button is available.
Background
User defined functions are stored in the /Matcalc/scripts/frame_scripts folder at your local MatCalc installation path. On the event of opening the 'Select new window' dialog, the folder is checked and the scripts found are presented (see picture above).
Remedy
Create the user defined function in the same way as you would create any other script. If you are not yet familiar with the MatCalc way of scripting, use one of the provided user-defined functions and modify them according to your needs.
Assume the following: You want to plot the weight percent of alloying elements in the phase over temperature in Celsius. Now have a look at the provided '01_all_phase_fractions over T_celsius.mcs' script:
new-gui-window p1                                  $ create plot window
move-gui-window . 150 100 600 500                  $ move and resize plot window

$ define default x-axis properties
set-gui-window-property . s u y                    $ use default x-axis for all plots
set-gui-window-property . s t temperature / °C     $ axis title
set-gui-window-property . x T$c                    $ x-axis data

$ define plot properties: phase fraction
set-plot-option . a y 1 t phase fraction           $ axis title
set-plot-option . s n b f$*                        $ add series
In order to plot the alloying elements of any or a certain phase, respectively, over the temperature in Celsius, you simply need to modify the last part of this script:
$ define plot properties: alloying elements
set-plot-option . a y 1 t fraction of chemical elements   $ axis title
set-plot-option . s n b x$PHASE$ELEMENT
Be aware that MatCalc can only handle one wildcard (*) at a time. You either have to choose a certain phase, e.g. x$fcc_a1$* to plot the chemical contents of the fcc_a1 phase, or a certain element, e.g. x$*$cr to plot the fraction of chromium in all phases.
It is of course always an option to plot a specific element in phase by using no wildcard: x$fcc_a1$cr.
Save the modified script by using a representative file name and save it to the path shown above. It should now be accessible via the user-defined dialog.
