Table of Contents
Example P80: Part 1: Models and parameters for the Fe-Cu precipitation simulation
Compatibility
MatCalc version: 5.52.0038
Database: mc_fe.tdb (newest version!), mc_sample_fe.ddb
Author: Georg Stechauner
Created: 2013-07-02
Revisions:
Objectives
In this first part of P80, we try to establish the theoretical and modeling basis for the following simulation. The precipitation problem is complex, which is why several independent models and parameters are considered in this example. All of these are necessary to achieve a realistic Fe-Cu precipitation simulation.
In addition to other implemented models in MatCalc, the following four are employed for the Fe-Cu system:
- Particle coalescence
- Diffuse interface energy correction
- Direct particle transformation
- Application of min G* nucleation energy concept
Note: The document P80-1 will only describe the physical background for the following simulation. The actual simulation is reported in P80-2.
Related documents
- P80-2 - Precipitation of Cu in Fe-Cu
- P80-3 - TTP plot in Fe-Cu system
- T. Jourdan, J.-L. Bocquet, F. Soisson, Modeling homogeneous precipitation with an event-based Monte Carlo method: Application to the case of Fe-Cu, Acta Mater. 58 (2010) 3295-3302.
- P. Warczok, J. Zenisek, E. Kozeschnik, Atomistic and continuums modeling of cluster migration and coagulation in precipitation reactions, Comp Mater Sci 60 (2012) 59-65.
- B. Sonderegger, E. Kozeschnik, Interfacial Energy of Diffuse Phase Boundaries in the Generalized Broken-Bond Approach, Metall Mater Trans A 41 (2010) 3262-3269.
- M. Perez, F. Perrard, V. Massardier, X. Kleber, V. Schmitt, A. Deschamps, Low Temperature Solubility Limit of Copper in Iron, Materials Science Forum 500-501 (2005) 631-638.
- P. J. Othen, M. L. Jenkins, G. D. W. Smith, High-resolution electron microscopy studies of the structure of Cu precipitates in alpha-Fe, Phil Mag A 70 (1994) 1-24.
Main document
In the following subsections, the main physical mechanisms governing precipitation in the Fe-Cu system are discussed. Consideration of any of these is important to arrive at a 'predictive' simulation of Cu precipitation in alpha-Fe.
Consideration of coalescence
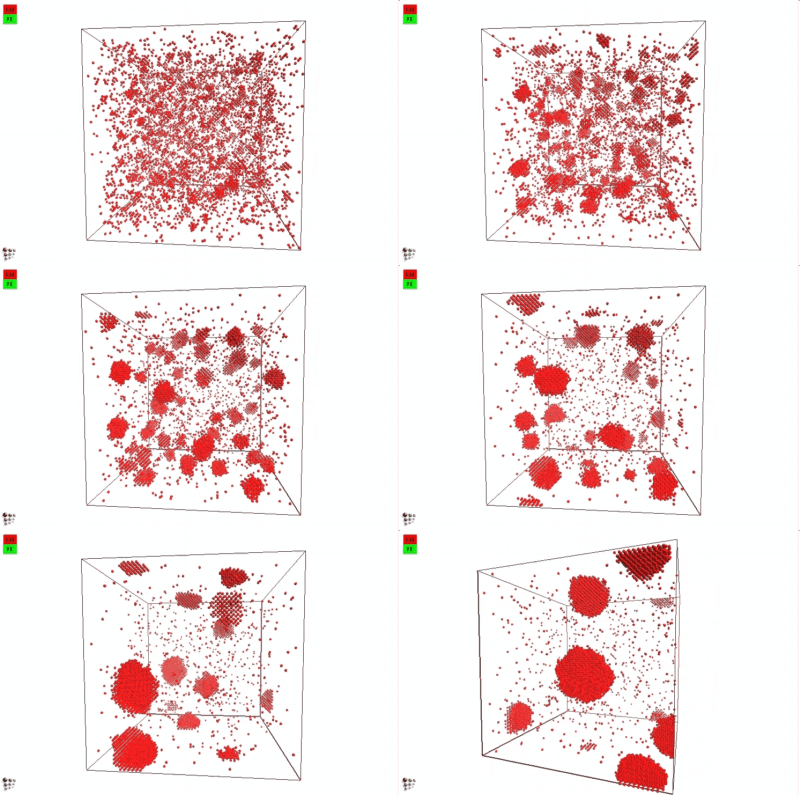
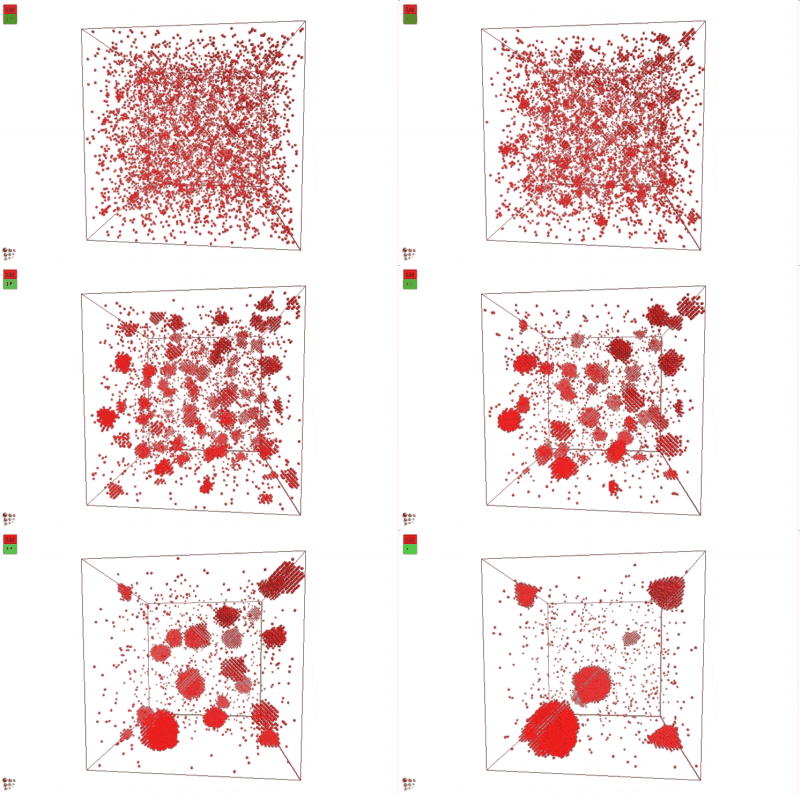
In 2012, Warczok et al. studied precipitation in Fe-Cu by means of atomistic and continuums modeling of cluster migration and coagulation. These authors found a strong tendency for particle coalescence in this system, the reason being found in an attractive interaction between Cu atoms and vacancies. The following films show an animation of particle coalescence from this work. The first movie considers a positive value of +2 for the parameter a, the second one an negative one of -2. This parameter governs the affinity of the vacancy to either matrix-forming Fe atoms or precipitate-forming Cu atoms/clusters. A positive value will maximize the CuVa bonds, while a negative one will maximize the FeVa bonds.
If one attempts to simulate Cu precipitation in the conventional MatCalc simulation framework1), growth of the Cu-precipitates will be observed as being way too slow. The reason is a mechanism change from attachment and detachment of monomers to the coalescence of larger Cu clusters, which become highly mobile in this system. With consideration of coalescence, it is possible (and necessary) to account for this change in growth mechanism correctly.
In the implementation of particle coalescence, we apply the model of Binder and Staufer with a comparably low Binder-Stauffer coefficient of -3/4. This value appears to be applicable for the Fe-Cu system. The mechanism itself has been confirmed by Jourdan et al. (2010), who simulated Cu migration in Fe and found that the movement of clusters is accelerated by several orders of magnitude compared to the movement (diffusion) of monomers, which are close to the Fe-self diffusivity. In the present version of MatCalc, this acceleration will be considered by a certain value for the 'matrix diffusion enhancement factor'.
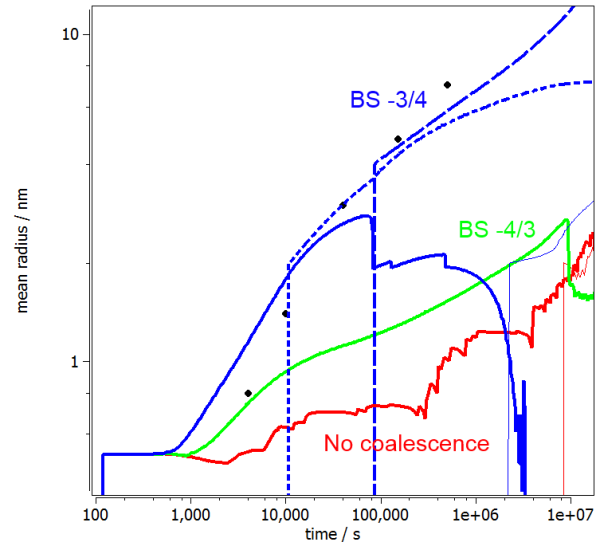
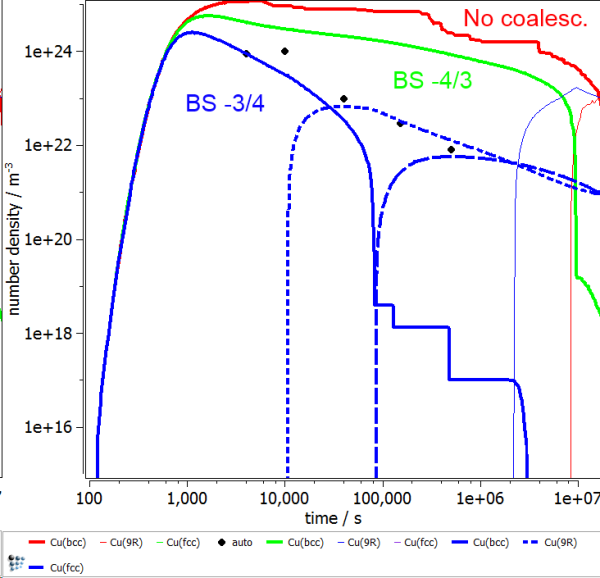
The following figures show the calculated radius and number density evolution in the Fe-Cu system. Experimental data by Goodman et al. (1973).
The impact of coalescence and the variation of BS-coefficient can be seen by the evolution of the 3 different curves in both figures. In the first case (red line), where no coalescence is considered, the radius stays below the transformation value for a long time and undergoes some fluctuations. At the same time, the number density stays almost constant. The experimental values are not reproduced at all. The first improvement comes with the consideration of some coalescence and a BS-coefficient according to literature by Binder and Stauffer (1977). Even though the onset of precipitation is simulated well, the further progression becomes too sluggish. The growth is too slow for this case. In a final approach the BS-coefficient was lowered to a value of -3/4. By this, the growth of precipitates is considered at the right speed, and the number density follows the experimental values well.
Energy of a diffuse interface
One of MatCalc's most outstanding features is the automatic calculation of the interfacial energy according to the generalized nearest neighbor – broken bond model. These calculations are, however, by default related to the sharp, planar case (the corresponding MatCalc variable is CIE$phase_name in the 'state variables GBB' category of the variables window). Usually, these values are automatically corrected for interfacial curvature (size correction 2)). The value of the size correction factor is depending on the radius of the precipitate. It can be observed via the variable PD_IE_S_CORR$phase_name in the 'kinetics: pref. distr.' category, which provides this data for each precipitate size class. The size correction applied in nucleation is accessible via the variable NUCL_CIE_S_CORR$phase_name in the 'kinetics: nucleation' section.
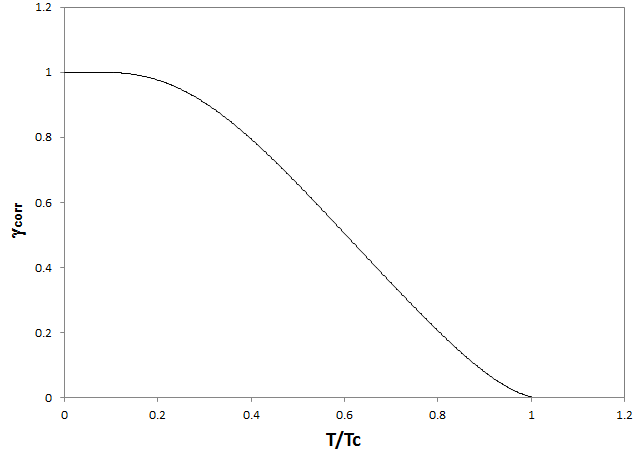
In systems at elevated temperatures, an additional effect must be accounted for, which is related to the observation that some configurational entropy-induced atomic mixing occurs across the interface and the 'real' interface is often not sharp, but diffuse. The 'diffuseness' of the interface generally reduces the interface energy value depending on temperature. The consideration of the diffuse interface happens by multiplication with an entropic factor, which ranges from one, at 0K, to zero, at the so-called regular solution critical temperature. The correction function, which is implemented in MatCalc, is depicted in the following graph. For evaluation of this factor, which can be inspected in the variable CIE_DI_CORR$phase_name in the 'kinetics: precipitates' category.
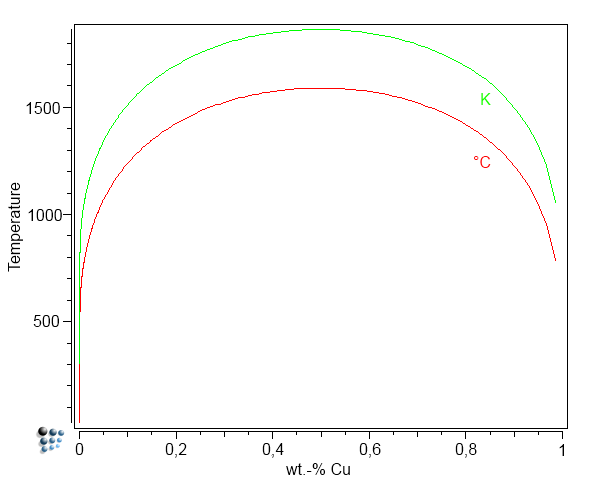
Unfortunately, the diffuse interface correction cannot be evaluated fully automated. To use this feature in MatCalc, the user must provide a pre-evaluated regular solution critical temperature, which is denoted as $T_c$. This temperature is related to the highest temperature in the phase diagram, where the precipitate is still stable. For the Fe-Cu system, $T_c$ can be read from the plot of miscibility gap in Fe-Cu shown below.
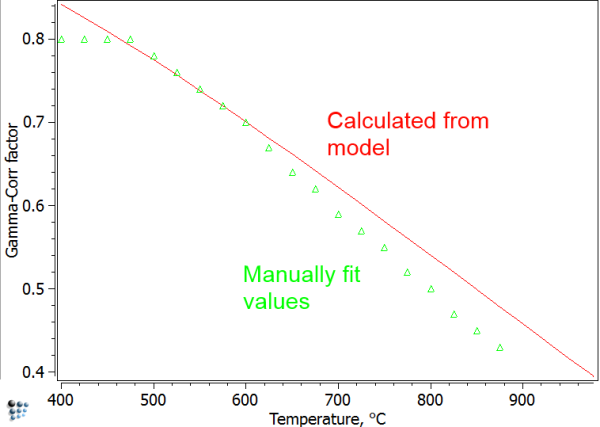
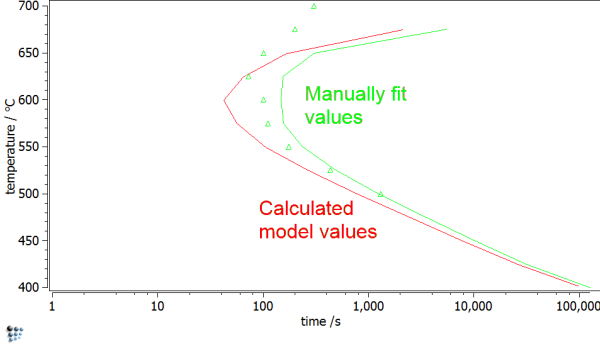
In earlier (unpublished) work, we tried to use MatCalc to simulate the TTP curves for Cu-precipitates published by Perez et al. (2005). The diffuse interface correction factor was considered in the simulation via an interfacial energy correction table that was calibrated by hand. With these values, and accounting also for the curvature effect (size correction) as well as the chemical composition from the minimum G* concept, interface energy correction values could be identified that reproduced the experimental TTP curve. Comparing these manually obtained fit values with the automatically calculated ones from the diffuse interface model and using a value of $T_c=1860K$, only a small difference is obtained. We take this as an indication that the model is working properly in this system.
Using the model parameters with no further correction, results in the green curve shown below. Although the experimental values are qualitatively depicted, the precipitation occurs consistently too late. Consideration of size effects and other phenomena leads to the red curve, of optimized parameters.
Transformation of particles
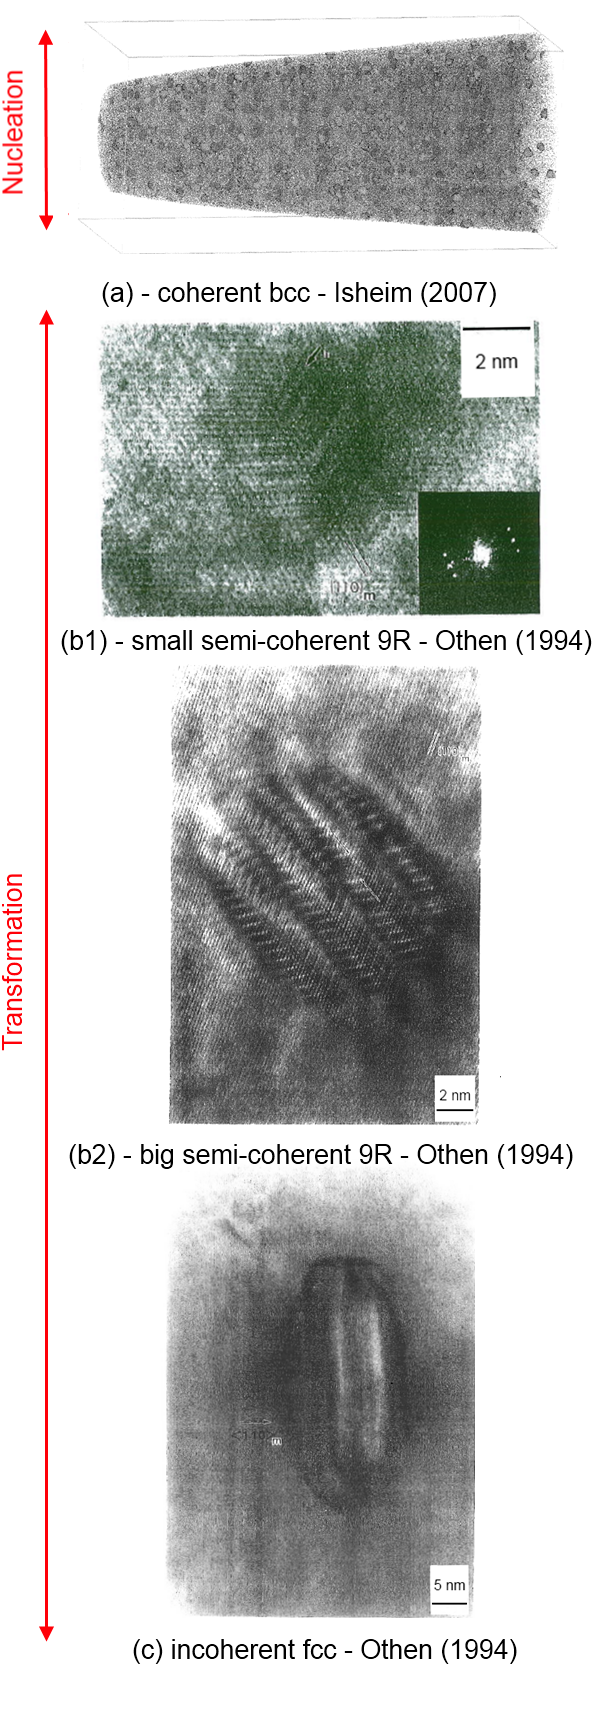
The transformation sequence of Cu precipitates was topic of numerous publications. A good description was performed by Othen et al.(1994). Based on the HR images of semi-coherent and incoherent precipitates, the transformation radii and precipitation sequence were defined as following: (a) nucleation as coherent bcc-Cu according to min G*; (b) transformation to semi-coherent 9R structure between 2-3nm. This has also been used in the simulation of Jourdan et al.(2010); (c) transformation to incoherent fcc-Cu between radii of 4-8nm.
Minimum nucleation energy G* calculation
The calculation and background on min G* have already been covered elsewhere.
Feel free to also consult examples E10 and in future E11 for more information on minimum nucleation energy.
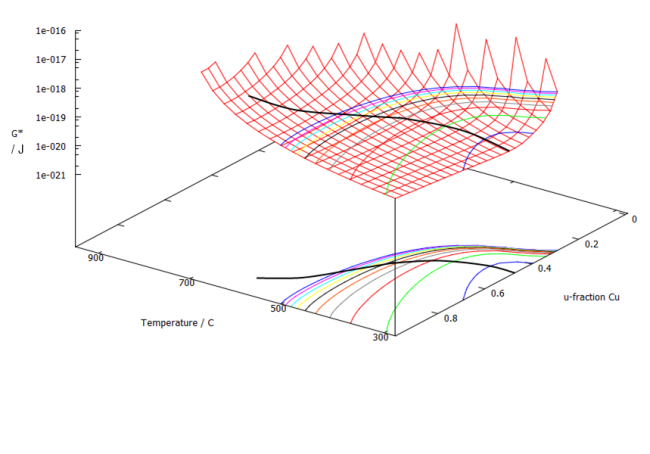
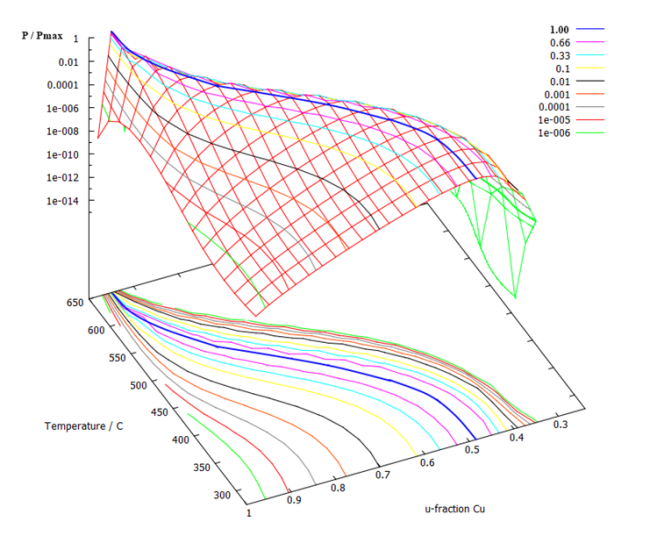
Performing the min G* and P calculation, respectively, for the Fe-Cu system as a function of Cu-content and temperature, leads to the following figures:
The calculated nucleation energy has a minimum as each temperature. At this very point, the probability for nucleation is the highest, which can be seen in the next figure. At low temperatures, the precipitate consists of almost 50% Fe and 50% Cu, whereas the nucleus at higher temperatures becomes Cu-rich. This is in accord with experiments.
Summary
Consideration of the previously mentioned parameters, models and effects, leads to a realistic description of the Fe-Cu system:
- Binder-Stauffer coefficient of -3/4. Further coalescence factor of 2, 3 and 4 for Cu-bcc, Cu-9R and Cu-fcc, respectively.
- Use of diffuse interface model with optimized parameters: critical temperature of 1860, interfacial energy correction 0.95*CIE$CU_BCC_1.
- Nucleation as coherent Cu particle according to min G* calculation. Transformation to 9R between 2-3nm, further transformation to incoherent Cu-fcc between 4-8nm.
Consecutive articles
The here elaborated models and parameters will be set to use in the following example P80_2 - Precipitation of Cu in Fe-Cu
