Table of Contents
Example P2: Precipitation sequence in Al-Cu, Part 2: Evolution of excess vacancies
Compatibility
MatCalc version: 5.50.0022
Database: mc_sample_al.tdb, mc_sample_al2.tdb, mc_sample_al.ddb
Author: Georg Stechauner
Created: 2012-03-09
Revisions:
Objectives
This example script simulates a technical Al-Cu alloy with 4.3 wt-% Cu. The script begins at high temperatures in the solution annealed condition where only the FCC_A1 matrix is present. Different quenching rates are applied to show their influence on the amount of quenched in vacancies. Difference between no model and FSK-model will be shown.
The three sections of this example show selected parameters and their influence on the vacancy site fraction. Always begin with the settings chosen in part one, and alter them according to the actual needs. It is highly recommended to use the provided scripts, or to at least read through and to try to understand them, as they simplify the amount of work that has to be done tremendously. Further do they enable easy parameter changes and otherwise time-consuming alterations of settings.
Related documents
Complementary files
Click here to view the script for section 1, Influence of quenching rate on vacancy evolution.
Click here to view the script for section 2, Influence of dislocation density on vacancy evolution.
Click here to view the script for section 3, Evolution of vacancy site fraction while reheating.
Main document
Setup thermodynamics and precipitation system
Use the settings shown in Part 1 to set up the system. Alternatively use the workspace file from part 1 and continue your evaluation from there.
Influence of quenching rate on vacancy evolution
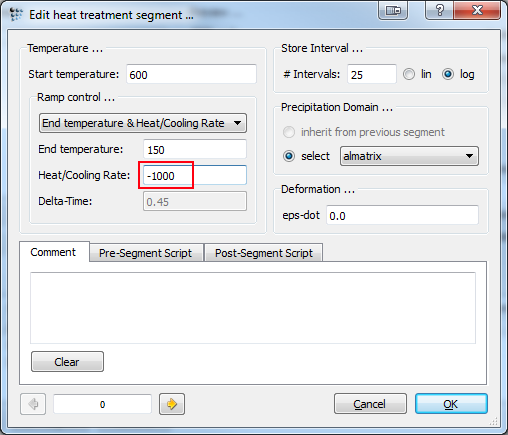
Modify the heat-treatment of part one in such manner, that the cooling rate from 600°C to 150°C varies between 1 and 1000 K/s (see red square). Set the second segment to an annealing time of 30.000 seconds. Perform the simulation 4 times and duplicate and lock the curves in between. Feel free to rename and change their appearance according to the picture below for a better visualization.
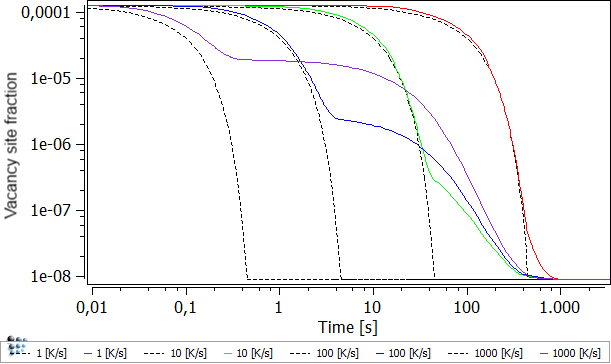
A variation in the quenching speed is shown in the figure below. The black, dashed line represents the equilibrium vacancy concentration, where the colored lines show the current excess vacancy concentration with respect to their quenching speeds.
The quenching-in of vacancies, thus the creation of excess vacancies due to high-cooling speeds, can easily be seen. For fast quenching rates, the vacancies, present at high temperatures, can not annihilate due to reduced diffusion rates at low temperatures which are present for the longest times. The opposite can be seen from the 1 K/s curve, where the current-vacancy density follows the equilibrium-vacancy density up to very long times. Only at the very end does a small difference appear.
Note: If you have a look at the script, you can see that the variation in quenching rate utilizes a for-loop. The runtime variable 'i' increases by 1 with each repetition and thus changes the exponential factor from 1 to 1000. The format-variable-string command is used to label the curves corresponding to their cooling rate.
Influence of dislocation density on vacancy evolution
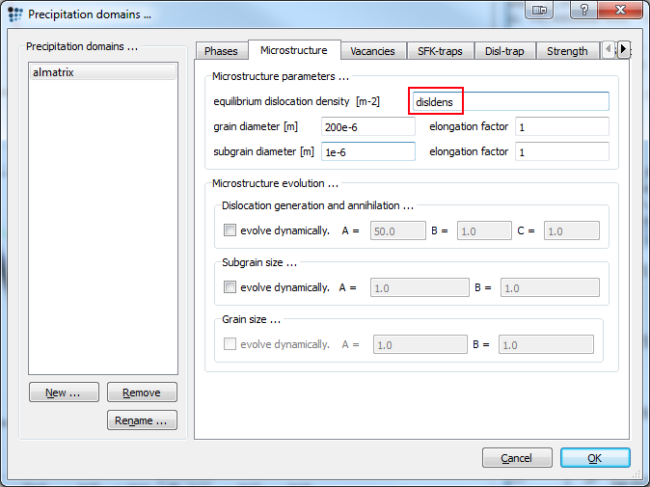
For the second section set the system up as before. Choose a quenching rate of 100 K/s from 600°C to 150°C. Anneal for 30.000 seconds at 150°C just as we did before. We are going to vary the dislocation density now for values between 1e10 and 1e14 (enter values in red box). Perform a calculation for each density and duplicate and lock afterwards. Rename and customize the curves to your pleasure.
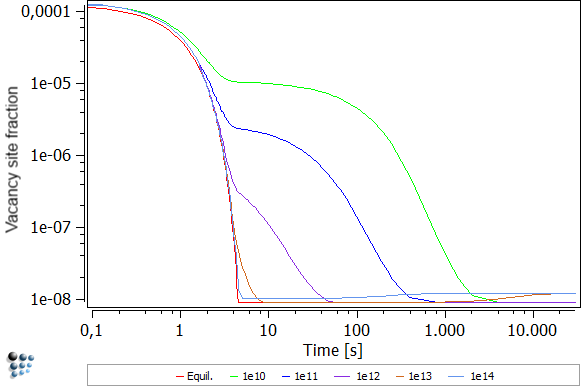
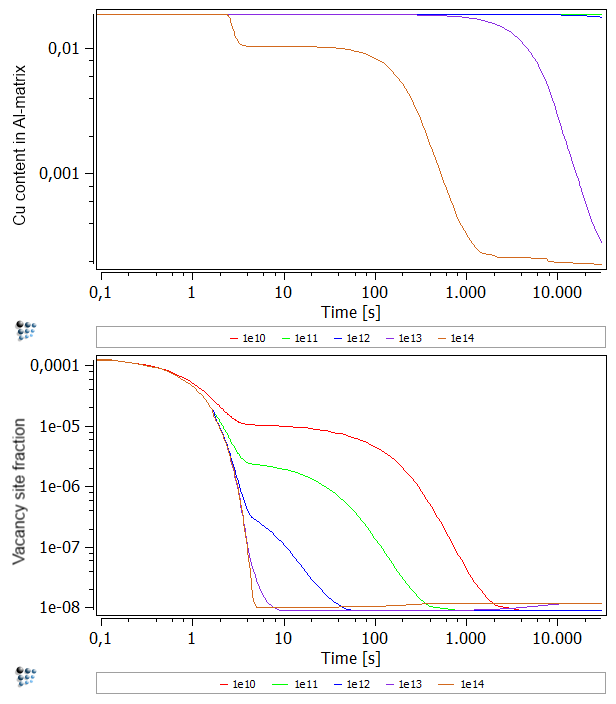
You will notice two things when looking on the figure below. For one, the equilibrium vacancy concentration is independent of the dislocation density. This is understandable, as the dislocation density enhance mainly the diffusion rate. As the equilibrium rate is independent of diffusion rates, as it always looks at a system after an infinite amount of time, there is no dependence. The second noticeable effect is the decrease in vacancies with increased dislocation density. Again, this effect can be explained by diffusion rate. As vacancies can move much faster through a system with high dislocation density, their annihilation occurs at a much faster rate, leaving less excess vacancies behind.
Another effect which is apparent from the figure above is that increase of the '1e13' density after about 1000 seconds and the different curve progression of the '1e14' curve. The reason for this behavior roots in the precipitation of the precipitates. As Al has a lower vacancy formation enthalpy than Cu, vacancies form easier in a pure Al matrix. Due to the increased dislocation density, the formation of precipitates is favored. Therefore, the matrix depletes on Cu which is shown below. As the Cu decreases in the matrix, the vacancy formation enthalpy approaches the Al value. Thus, the '1e13' and '1e14' curves show higher vacancy concentrations.
Upper figure: Content of Cu in Al-matrix for different dislocation densities.
Evolution of vacancy site fractions while reheating
This section treats the difference between the vacancy evolution of the equilibrium concentration compared to the current vacancies at various annealing times using the FSK vacancy dynamics model.
To plot the results, create a new P1 plot and drag'n'drop the variables PX_SV_Equil$almatrix and PX_SV_Curr$almatrix, located in kinetics:pd special, to the plot. Open the heat treatment dialog window and modify the heat treatment used before, by changing the annealing time in segment 1. Alter the values from 100 to 1e6, for each simulation cycle. Perform the precipitation kinetics simulation using this very temperature profile and set the maximal T-step to 4K. Duplicate and lock after each simulation, change annealing time as mentioned, and repeat the simulation.
Note …
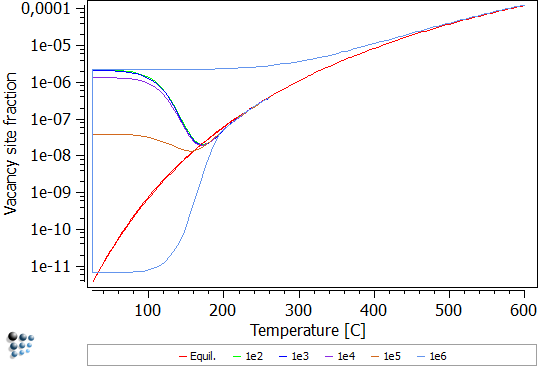
The red curve equals the equilibrium concentration and does not change with annealing time, quenching rate, etc. as it is always in equilibrium. The other curves however are quenched and contain a great amount of excess vacancies. Upon annealing, these vacancies reduce due to the formation of Theta'' as well as annihilation processes. It is important to note, that high excess vacancy concentrations are prime to the nucleation of Theta'' at such low temperatures, due to increasing the diffusivity considerably.
After various annealing times (100 to 1e6 seconds) at room temperatures, the alloy is heated up to 250°C with a heating rate of 10K per minute. Without consideration of excess vacancy trapping, the following figure is simulated:
It is apparent that the vacancy site fraction reduces even further upon increasing the temperature, up to intersect with the equilibrium site fraction. From there on, the actual site fraction follows the progress of the equilibrium curve. For very long annealing times, here 1e6 seconds, most excess vacancies are annihilated. Therefore, when re-heating, vacancies have to be formed anew. As this is a time-consuming process, the actual vacancy site fraction can not follow the equilibrium.
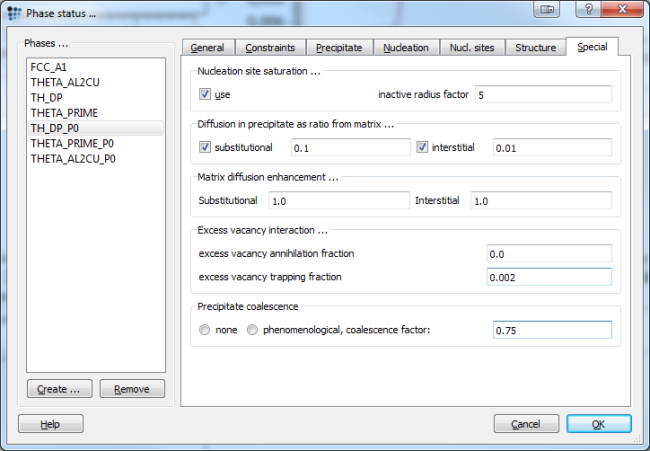
Another case is given when considering excess vacancy trapping. The current MatCalc approach to excess vacancy trapping is to define a certain fraction, which is then considered to be trapped and will not be accounted for any further. Open the phase status dialog window and go to special tab for TH_DP_P0 as the selected phase. Enter 0.002 for excess vacancy trapping fraction and a value of 0.75 for the coalescence factor.
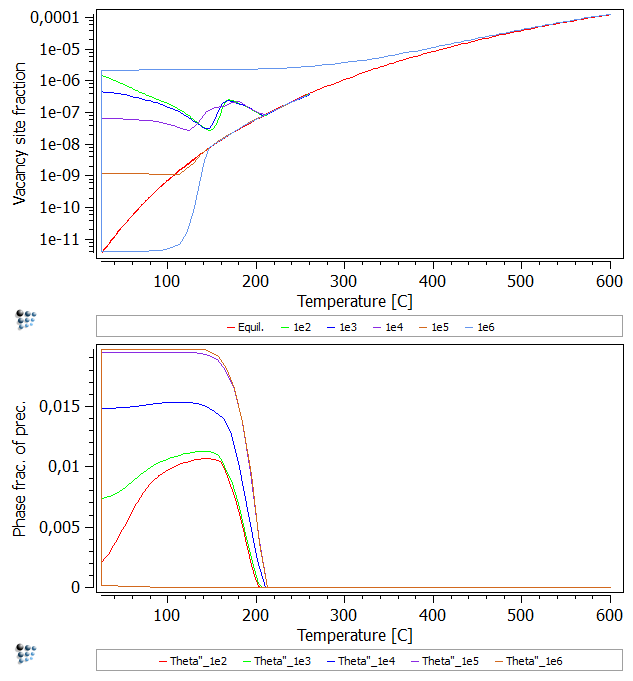
Perform the simulation again (Remove the two dollar signs $ at the TH_DP_P0 precipitate setup in the script and run the above provided script). An additional regime can be observed. At 1e2 to 1e4 seconds: upon reheating, the vacancy site fraction initially decreases, as the phase fraction of Theta'' keeps increasing. Arriving at temperatures of 130-140°C a bulge can be observed. The increase in vacancy site fraction at the bulge is formed, as a certain amount of trapped vacancies is freed while the precipitates dissolve. The decrease which follows shortly after is the result of the still ongoing annihilation of vacancies due to increasing the temperature. This bulge can be seen as the cumulative curve of …
- … the vacancy site fraction increasing effect of setting trapped vacancies free.
- … the vacancy site fraction decreasing effect of vacancy annihilation due to the FSK model.
Consecutive articles
none
