Table of Contents
Example P1: Precipitation of cementite in Fe-0.1%C, Part 2: Setup of simulation for analysis of precipitate distributions
Compatibility
MatCalc version: 5.44.1002
Database: mc_sample_fe.tdb, mc_sample_fe.ddb
Author: Georg Stechauner
Created: 2012-02-08
Revisions:
Objectives
This example demonstrates the basics of every precipitation simulation and thoroughly guides through setup and calculation. The precipitation of cementite in ferrite is of special interest in this example. Furthermore will be the grain size, nucleation rate and other general precipitation-related features. A comparison of the numerical simulation with the classical Lifshitz-Slyozov-Wagner (LSW) size distribution is also presented.
Related documents
- C. Wagner, Theorie der Alterung von Niederschlägen durch Umlösen, Zeitschrift für Elektrochemie, Bd 65 (1961) Nr. 7/8, 581-591.
- I. Lifshitz, V. V. Slyozov, The kinetics of precipitation from supersaturated solid solutions, J. Phys. Chem. Solids 19 (1961) 35-50.
- K. G. F. Janssens, D. Raabe, E. Kozeschnik, M. Miodownik, B. Nestler, Computational Materials Engineering - An Introduction to Microstructure Evolution, Elsevier Inc (2007) 206-209.
Adding more size classes
In order to smoothen the precipitate distribution curve, more size classes have to be added. Open the 'Phase status' dialog and change the number of size classes in the precipitation tab to #1000.
If you perform the calculation with the same settings as before, the information in the output window indicates that the nucleation process advances to fast to occupy all available size classes in the simulation. As a result, only 69! size classes from 1000 are filled up with precipitates before the C-supersaturation is so much reduced that nucleation seizes.
Set the 'update every' frequency in the 'set-simulation-parameter' command menu to 10 and have a close look at the output window:
After 20 steps:
CEMENTITE_P0: (12/+.g./4e+008/d)

After 70 steps:
CEMENTITE_P0: (62/+.g./4e+020/d)

After 120 steps:
CEMENTITE_P0: (64/..g./4e+020/d)
The pasted lines above read as follows: Cementite_p0 has 12 filled size classes after 20 steps; + the number of cementite nuclei is still increasing; The '+' sign indicates that nucleation events occur in the particular iteration, 'g' indicates that at least one size class has grown its particles; '4e+008' is the number density of precipitates; 'd' stands for nucleation site of dislocation.
Thus, only increasing the 'maximum number of size classes' setting does not change anything in the present case. We need to slow down the nucleation, and this can be done by utilizing the MatCalc 'convergence' parameters.
Increasing accuracy of simulation
The convergence parameter we are about to change regulates how many nuclei are allowed to form within each time step of the numerical integration procedure. Enter into console (there is no GUI implementation for this option as of now):
set-simulation-parameter C N B 1.03
The corresponding convergence control parameter is called 'nucleation density increase factor' and it has a default value of 2. A factor of 2 means, that within each time step, the number of new nuclei can double compared to the previous step. A value of 1.5 would mean that the number can increase by 50%, hence 1.03 stands for an increase of 3% per iteration. By choking the nucleation speed, MatCalc has enough time to fill all the created size classes with nuclei. A default factor of 2 has resulted in a much faster nucleation, however, also much fewer nuclei.
After 20 steps:
CEMENTITE_P0: (12/+.g./1e+006/d)

After 510 steps:
CEMENTITE_P0: (502/+.g./9e+012/d)

After 1010 steps:
CEMENTITE_P0: (1000/+.g./2e+019/d)
From the output above, we can see that less nuclei are created untl the limit of size classes is reached. If you compare the number density after 20 steps from before and now, you can see that, without the convergence factor setting, more than 100 times more nuclei are formed. With an increase rate of 3% per iteration for the nucleation rate, nucleation still continues when all size classes are filled. This is not a problem in MatCalc, since the handling of size classes during continued nucleation is carried out by MatCalc automatically. The major effect of the modified convergence parameter is that 1000 size classes could be filled in the nucleation process instead of only 64 when using the default settings.
Note: Because of the high amount of size classes, the whole simulation will now take 32 (!) minutes, instead of just 1! Increased accuracy is often achieved only at the cost of computational power. However, a comparison of the precipitate distribution of 25 size classes to 1000 indicates that the additional effort is worth it at least in terms of the obtained size distribution.
Start precipitation simulation
Start the simulation like in part 1! Attention: This calculation is a bit time demanding due to the high amount of size classes. The calculation will take about 30 minutes on a strong, new computer bought in 2011. So, get yourself a coffee while you wait 
Results
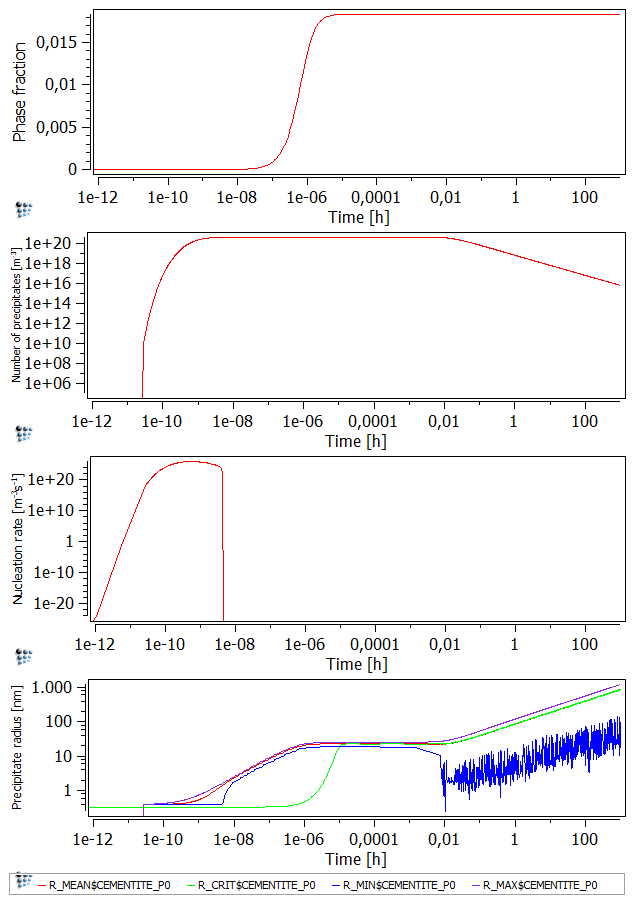
The results concerning phase fraction, number density, nucleation rate and precipitate radius look very alike to the ones of part 1.
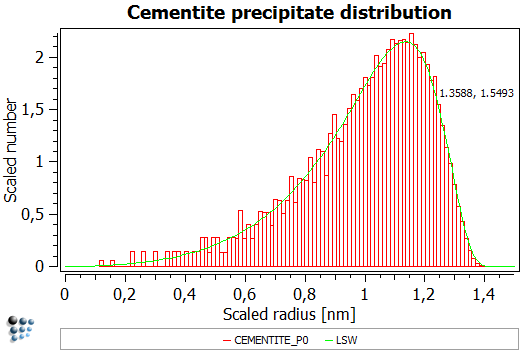
However the precipitate distribution is what really changed due to the increased number of size classes. The figure below shows a diagram with 100 'averaged' size classes evaluated from the 1000 size class calculation. The LSW function is reproduced very accurately and smooth.
Results: Evolution of precipitate distribution
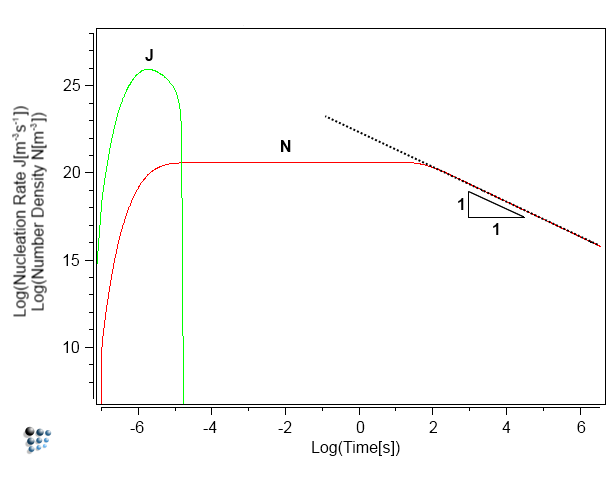
In the initial stages of the precipitation process, the nucleation rate increases steadily due to the transient effect of incubation time. The number of precipitates continuously increases as well as the mean radius of the precipitates. If supersaturation decreases because the matrix is slowly depleted from solute atoms (or if all possible nucleation sites have been used) nucleation of new precipitates comes to a stop. At this point, the nucleation rate drops to zero (green curve)…
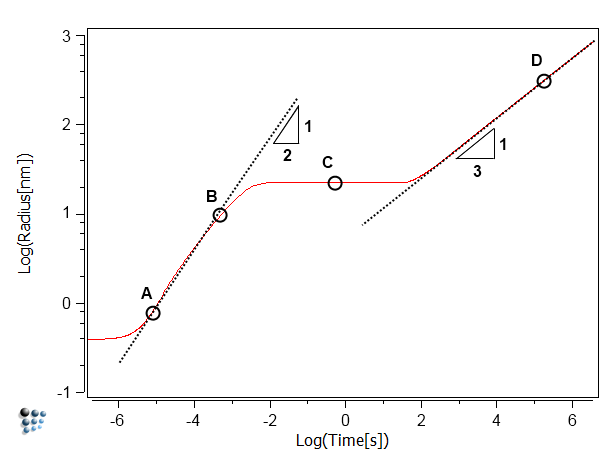
… and the mean radius exhibits a linear increase due to the fact that only growth of a constant number of precipitates occurs. Since the growth kinetics are determined by a parabolic law (which is one of the ingredients of the numerical Kampmann-Wagner (NKW) model), the slope of the increase of the mean radius in the figure below is constant and equal to 1/2.
Several important features of a solid-state precipitation reaction are readily observed in the calculation results.
- A: Until approximately point A in the diagram, nucleation dominates the precipitate evolution. The number density of precipitates increases significantly while the other precipitation parameters do not.
- Between points A and B, the number density remains approximately constant, which means that nucleation has seized. in this regime, growth of precipitates dominates the reaction.
- B: Shortly after point B, the matrix content of solute atoms approaches the equilibrium value, supersaturation approaches one and precipitate growth comes to a stop. At this point, the curve of the mean radius exhibits a plateau.
- C: Within several orders of magnitude of time, the mean precipitate radius and the number density now remain constant. The major observable change in the precipitate population before coarsening starts is a transition from a left-shifted size distribution to a right-shifted size distribution (points A → B → C).
- D: In the final stage of the precipitation reaction, the smallest precipitates dissolve in favor of the larger ones (Gibbs-Thomson effect). Consequently, the number density of precipitates slowly decreases. In the double logarithmic number density over time plot of the above shown figure, this decrease is linear with time and the slope of the decrease is equal to one. Simultaneously, it can be seen from the radius over time plot that the mean radius of the precipitate distribution increases continuously with a slope of 1/3. This is consistent with the theoretical value for the coarsening exponent as obtained from the Lifshitz-Slyozov-Wagner (LSW) theory of Ostwald ripening. In the asymptotic limit of coarsening, the precipitate size distribution approaches a stationary state, where the shape of the normalized size distribution is time invariant. In the representative size distribution for the coarsening regime (point D), the distribution obtained with the NKW model is compared to the theoretical distribution of the LSW theory (green line).


