Table of Contents
Example D31: Evaluation of diffusion coefficients
Compatibility
MatCalc version: 5.50
Author: G. Stechauner
Created: 2012-05-09
Revisions:
Objectives
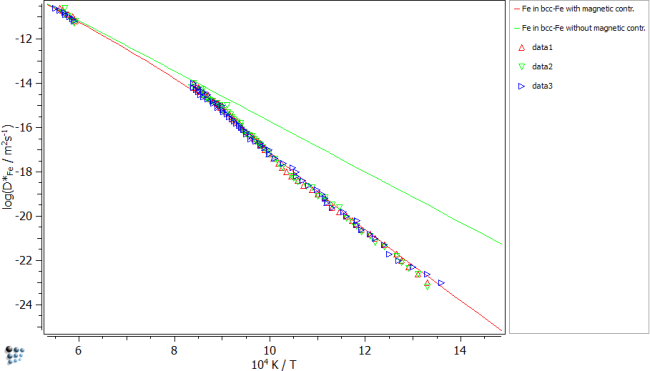
The calculation and plotting of diffusion parameters is a strong and useful feature which comes along with MatCalc. This example shows the self diffusion of Fe in bcc-Fe with respect to the magnetic contribution. Experimental data provided by Jönsson is reproduced well.
Related documents
- B. Jönsson, Z. Metallkd. 83 (1992) 5
Complementary files
Click here to view the script for this tutorial. Click here to download the table-script for example D31.
Main document
Set up the system considering only pure iron with BCC_A2 phase. This way, only tracer diffusion of Fe in bcc-Fe is possible. The experimental data reproduces the diffusion parameters under consideration of magnetic influence. Diffusion values without magnetic contribution are based on MatCalc calculations.
Calculation
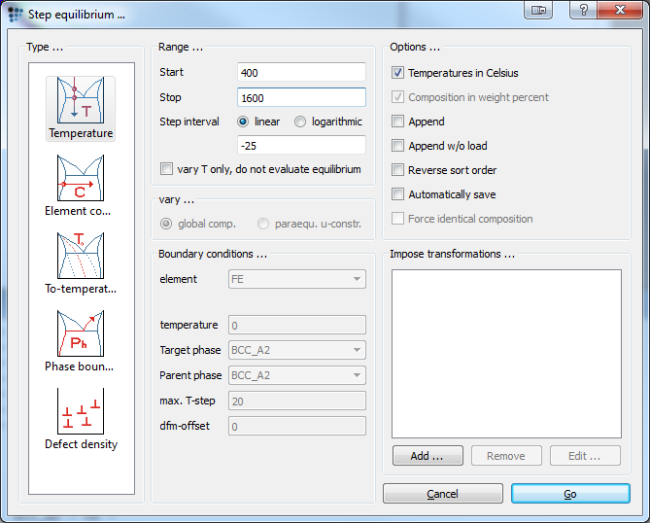
To calculate the diffusion parameters perform a stepped calculation, varying the temperature in a desired range (We use 1600C to 400C with a 25C step).
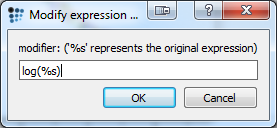
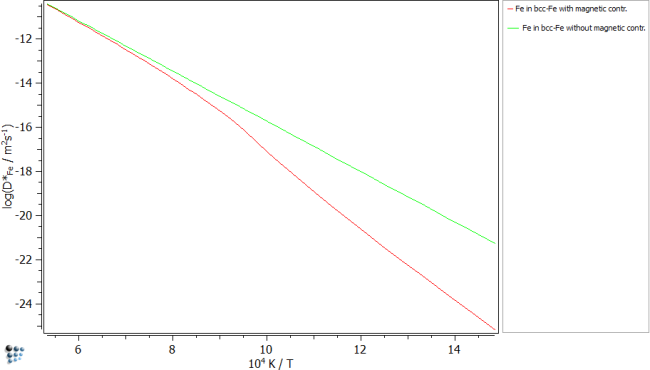
To plot the tracer diffusivity, simply drag and drop the value DT$BCC_A2$FE into a p1 plot window. The variable can be found in the diffusion section on the left-hand side of the screen. In order to obtain y-axis values as shown in the picture, without the preceding 10^…, hold CTRL before dropping the variable into the plot. A popup window will appear which gives the option to modify the expression. %s respresents the original expression, thus by adding a log, the logarithmic values will be plotted.
Plot without considering magnetic contribution
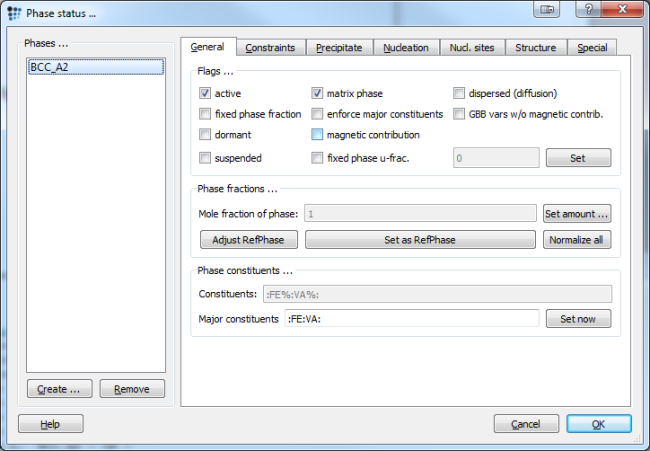
To plot the second curve, go ahead and duplicate and lock the tracer diffusivity curve. Feel free to rename the curve correspondingly using the Options panel on the left-side. Open up the Phase status dialog and deselect the check box for magnetic contribution.
Now perform the stepped calculation anew and the earlier duplicated curve will change. A higher diffusivity will be the result as the new curve lies above the old one. The figure below should resemble the one in your MatCalc and represents the final results without experimental vlaues.
Add some experimental data
Experimental data on diffusion values can be found in adequate literature. The data in this example is taken from the above cited work of B. Jönsson. It is highly recommended to run this short sub-script which adds three tables, instead of creating the tables manually due to the large amount of values.
The final figure is obtained after plotting the experimental data or running the sub-script, respectively.
